The problem: Binding isotherms without going to high enough concentrations
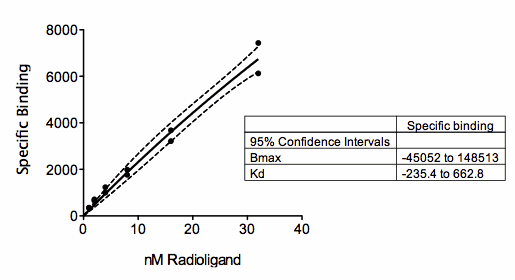
The figure above shows a saturation binding equation fit to specific binding data. But all the concentrations are relatively low (compared to the Kd of binding) so the data almost form a straight line. The saturation binding model fits the data fine (solid curve), with a narrow 95% confidence band around the curve (dashed lines). But look at the confidence interval for Bmax and Kd (shown in the box)! They are super wide, even descending into negative (impossible) values. With these data, the curve fit the data fine, but neither parameter in the model (Bmax and Kd) were fit with reasonable confidence intervals. This is no surprise. The data don’t show even a hint of plateauing, so the data simply don’t define the Bmax and Kd at all.
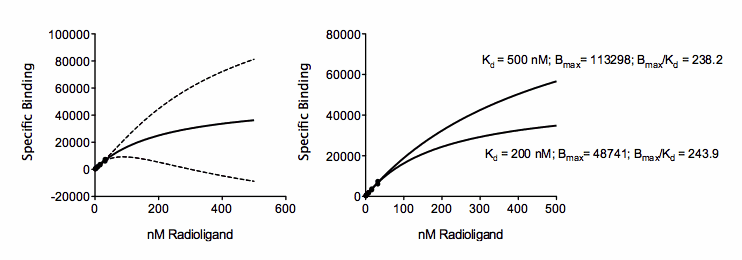
The problem is that the data are consistent with a system with a huge number of low affinity receptors (high Bmax; high Kd) or a smaller number of high affinity receptors (low Bmax; low Kd). The figure below shows two ways the visualize this. The graph on the left shows the same fit as the one above, but with the best-fit curve and its confidence bands extended out to larger concentrations. While the confidence band is tight near the points, is it super wide as it goes beyond concentrations with data. The graph on the right show two different fits, with the Kd constrained to equal 200 nM or 500 nM. The curves are very different, yet both go near the data.
Another way to look at the problem with these data is that the Bmax and Kd are correlated. Prism can report the covariance matrix as part of its nonlinear regression results. With only two parameters, there is only one value in that "matrix". The covariance between Kd and Bmax (which can range from 0.0 to 1.0) is 0.9993. Prism can also report the dependency of each parameter (which also can range from 0.0 to 1.0). With only two parameters, both have the same dependency, which is 0.9986 for this example. This is not quite high enough for Prism to declare the results ambiguous, but the threshold for that designation (dependency > 0.9999) is arbitrary.
It is tempting to give up at this point and say that nothing can be determined without more data at higher concentrations. But in some systems, especially those using PET scanning to detect receptors, data like this are typical. It is impossible to use higher concentrations of ligand.
Fitting the binding potential
What can be learned from these data? The data are nearly linear. What does the slope of that line tell us? The slope, or rather the initial slope, is termed the binding potential (1). Don’t be mislead by the term potential. It has nothing to do with potential energy and thermodynamics. Rather it is a measure of how much binding will occur with a small amount of ligand.
If you start with the specific binding equation, take its derivative with respect to X (which is concentration), and set X equal to zero, you’ll derive the initial slope of a specific binding curve. It turns out that this slope, the binding potential, equals Bmax/Kd. Bmax is measured in the same units as the Y values in the data. Kd is measured in the same units as the X values. So the binding potential has units equal to the Y units divided by the X units.
Prism can fit a specific binding curve, and also report the ratio of Bmax/Kd with its confidence interval. To do this either create a new user-defined equation or (easier) clone the built in one. Then go to the last tab of the dialog that defines the equation. “Transforms to Report”. Choose to report the ratio of two parameters, and define the numerator and denominator.

In this example, Prism finds that the Binding Potential is 242.1, with a confidence interval ranging from 183.4 to 300.7. That confidence interval is reasonably narrow, so the result is quite useful.
Reference
1. Innis et al. Consensus nomenclature for in vivo imaging of reversibly binding radioligands. Journal of Cerebral Blood Flow & Metabolism (2007) vol. 27 (9) pp. 1533-1539