This equation is used when X values are logarithms of doses or concentrations. Use a related equation when X values are concentrations or doses.
Introduction
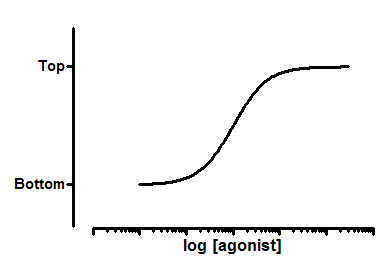
Many log(dose) vs. response curves follow the familiar symmetrical sigmoidal shape. The goal is to determine the EC50 of the agonist - the concentration that provokes a response half way between the basal (Bottom) response and the maximal (Top) response.
This model assumes that the dose response curve has a standard slope, equal to a Hill slope (or slope factor) of 1.0. This is the slope expected when a ligand binds to a receptor following the law of mass action, and is the slope expected of a dose-response curve when the second messenger created by receptor stimulation binds to its receptor by the law of mass action. If you don't have many data points, consider using the standard slope model. If you have lots of data points, pick the variable slope model to determine the Hill slope from the data.
This equation is sometimes called a three parameter dose-response curve. If you also fit the Hill slope, then it is a four parameter equation.
Step by step
Create an XY data table. Enter the logarithm of the concentration of the agonist into X. Enter response into Y in any convenient units. Enter one data set into column A, and use columns B, C... for different treatments, if needed.
If you prefer to enter concentrations, rather than the logarithm of concentrations, use Prism to transform the X values to logs.
From the data table, click Analyze, choose nonlinear regression, choose the panel of equations "Dose-response curves - Stimulation" and then choose the equation log(Agonist) vs. response.
If you have subtracted off any basal response, consider constraining Bottom to a constant value of 0.
Model
Y=Bottom + (Top-Bottom)/(1+10^((LogEC50-X)))
Interpret the parameters
EC50 is the concentration of agonist that gives a response half way between Bottom and Top. This is not the same as the response at Y=50. Depending on which units Y is expressed in, and the values of Bottom and Top, the EC50 may give a response nowhere near "50". Prism reports both the EC50 and its log.
Top and Bottom are plateaus in the units of the Y axis.