Why you should not use R2 to compare models
R2 quantifies how well a model fits the data, so it seems as though it would be an easy way to compare models. It sure sounds easy -- pick the model with the larger R2. The problem with this approach is that there is no penalty for adding more parameters. So the model with more parameters will bend and twist more to come nearer the points, and so almost always has a higher R2. If you use R2 as the criteria for picking the best model, you'd almost always pick the model with the most parameters.
The adjusted R2 accounts for the number of parameters fit
The adjusted R2 always has a lower value than R2 (unless you are fitting only one parameter). The equations below show why.
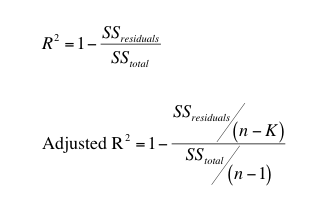
The equations above show how the adjusted R2 is computed. The sum-of-squares of the residuals from the regression line or curve have n-K degrees of freedom, where n is the number of data points and K is the number of parameters fit by the regression. The total sum-of-squares is the sum of the squares of the distances from a horizontal line through the mean of all Y values. Since it only has one parameter (the mean), the degrees of freedom equals n-1.
When K=1, adjusted R2 and the ordinary R2 are identical. When K>1, The adjusted R2 is smaller than the ordinary R2 (the Prism 6 Help had this backwards.)
Using adjusted R2 and a quick and dirty way to compare models
A quick and easy way to compare models would seem to be to choose the one with the smaller adjusted R2. Choose to report this value on the Diagnostics tab.
Comparing models with adjusted R2 is a standard method for comparing models fit with multiple linear regression. It is not standard for nonlinear regression for good reason. Speis and Neumeyer(1) did simulations that showed that using the adjusted R2 is a horrible way to choose among competing models. We suggest that you use the extra-sum-of-square F test or comparing AICc instead. If you do compare models by comparing adjusted R2, make sure that identical data, weighted identically, are used for all fits. But even then, know that models that fit very differently as assessed by AICc may have R2 values that differ only in the third to fifth digit after the decimal (1).
Adjusted R2 in linear regression
Prism doesn't report the adjusted R2 with linear regression, but you can fit a straight line with nonlinear regression.
If X and Y are not linearly related at all, the best fit slope is expected to be 0.0. If you analyzed many randomly selected samples, half the samples would have a slope that is positive and half the samples would have a negative slope. But in all these cases, R2 would be positive (or zero). R2 can never be negative (unless you constrain the slope or intercept so it is forced to fit worse than a horizontal line). In contrast, the adjusted R2 can be negative. If you analyzed many randomly selected samples, you'd expect the adjusted R2 to be positive in half the samples and negative in the other half.
Here is a simple way to think about the distinction. The R2 quantifies the linear relationship in the sample of data you are analyzing. Even if there is no underlying relationship, there almost certainly is some relationship in that sample. The adjusted R2 is smaller than R2 and is your best estimate of the degree of relationship in the underlying population.
1. Spiess, A.-N. & Neumeyer, N. An evaluation of R2 as an inadequate measure for nonlinear models in pharmacological and biochemical research: a Monte Carlo approach. BMC Pharmacol 10, 6–6 (2010).