The term repeated-measures refers to an experiment that collects multiple measurements from each subject. The analysis of repeated measures data is identical to the analysis of randomized block experiments that use paired or matched subjects. Prism can calculate repeated-measures two-way ANOVA when either one of the factors are repeated or matched (mixed effects) or when both factors are. In other words, Prism can handle these three situations with its two-way ANOVA analysis:
•Two between-subject variables (neither factor is repeated measures)
•One between-subject variable and one within subject variable
•Two within-subject variables (both factors are repeated measures)
One data table can correspond to four experimental designs
Prism uses a unique way to enter data. You use rows and columns to designate the different groups (levels) of each factor. Each data set (column) represents a different level of one factor, and each row represents a different level of the other factor. You need to decide which factor is defined by rows, and which by columns. Your choice will not affect the ANOVA results, but the choice is important as it affects the appearance of graphs.
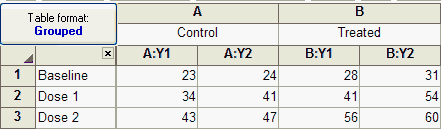
The table above shows example data testing the effects of three doses of drugs in control and treated animals.
These data could have come from four distinct experimental designs.
Not repeated measures
The experiment was done with six animals. Each animal was given one of two treatments at one of three doses. The measurement was then made in duplicate. The value at row 1, column A, Y1 (23) came from the same animal as the value at row 1, column A, Y2 (24). Since the matching is within a treatment group, it is a replicate, not a repeated measure. Analyze these data with ordinary two-way ANOVA, not repeated-measures ANOVA.
Matched values are spread across a rows
The experiment was done with six animals, two for each dose. The control values were measured first in all six animals. Then you applied a treatment to all the animals and made the measurement again. In the table above, the value at row 1, column A, Y1 (23) came from the same animal as the value at row 1, column B, Y1 (28). The matching is by row.
Matched values are stacked into a subcolumn
The experiment was done with four animals. First each animal was exposed to a treatment (or placebo). After measuring the baseline data (dose=zero), you inject the first dose and make the measurement again. Then inject the second dose and measure again. The values in the first Y1 column (23, 34, and 43) were repeated measurements from the same animal. The other three subcolumns came from three other animals. The matching was by column.
Repeated measures in both factors
The experiment was done with two animals. First you measured the baseline (control, zero dose). Then you injected dose 1 and made the next measurement, then dose 2 and measured again. Then you gave the animal the experimental treatment, waited an appropriate period of time, and made the three measurements again. Finally, you repeated the experiment with another animal (Y2). So a single animal provided data from both Y1 subcolumns (23, 34, 43 and 28, 41, 56).
When do you specify which design applies to this experiment?
The example above shows that one grouped data set can represent four different experimental designs. You do not distinguish these designs when creating the data table. The data table doesn't "know" wether or not the data are repeated measures. You should take into account experimental design when choosing how to graph the data. And you must take it into account when performing two-way ANOVA. On the first tab of the two-way ANOVA dialog, you'll designate the experimental design.
Lingo: "Repeated measures" vs. "randomized block" experiments
The term repeated measures is appropriate when you made repeated measurements from each subject.
Some experiments involve matching but not repeated measurements. The term randomized-block describes these kinds of experiments. For example, imagine that the three rows were three different cell lines. All the Y1 data came from one experiment, and all the Y2 data came from another experiment performed a month later. The value at row 1, column A, Y1 (23) and the value at row 1, column B, Y1 (28) came from the same experiment (same cell passage, same reagents). The matching is by row.
Randomized block data are analyzed identically to repeated-measures data. Prism always uses the term repeated measures, so you should choose repeated measures analyses when your experiment follows a randomized block design.