What is the test for trend?
Prism can test for linear trend as part of the followup testing after one-way (but not two- or three-way) ANOVA. It is a choice on the Multiple Comparisons tab of the parameters dialog for one-way ANOVA.
This test makes sense when the columns represent ordered and equally spaced (or nearly so) groups. For example, the columns might represent age groups, or doses or times. The test for linear trend asks whether the column means increase (or decrease) systematically as the columns go from left to right.
Alternative names are testing for a linear contrast, post-test for trend, and test for linear trend.
Are you sure you don't want to do regression?
Note that ANOVA calculations (except for this trend test) completely ignore the order of the columns. You could randomly scramble the column order, and get exactly the same ANOVA results. So if the columns represent time points or concentrations or anything that can be quantified, think hard about whether ANOVA is the best way to analyze your data. Rather than do ANOVA followed by a test for linear trend, you may want to fit the data with linear (or nonlinear) regression.
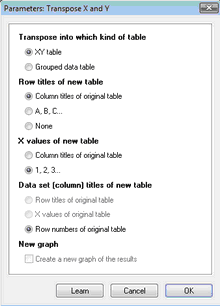
After you've entered your data for ANOVA, you'll need to rearrange (transpose) the data if you want to analyze the same data with regression.
1.From the column table used for ANOVA, click Analyze and choose the Transpose analysis.
2.Select that the results should be an XY results table with sequential X values.

3.From the completed XY table, click Analyze and choose linear regression.