Prism offers three ways to create graphs that combine points and bars.
XY
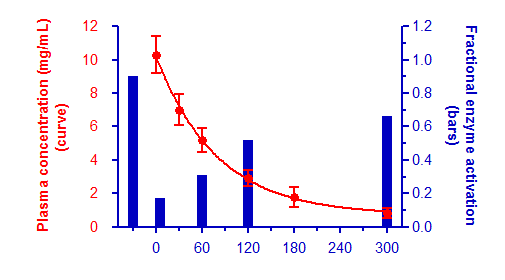
Create an XY graph and then tell Prism to plot a data set (or several) as spikes or bars. Detailed instructions to create the graph below.
Grouped
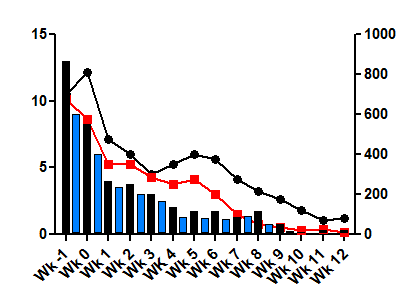
Create a grouped bar graph, then tell Prism to plot one data set (or several) as points. Detailed instructions for creating the graph below.
Create two graphs and superimpose them on a layout
A third approach to getting bars and points on what appears to be one graph is to create one XY graph and one column graph, and then tell Prism to superimpose them on a page layout. Detailed instructions to create the graph below.
