Spaghetti graphs plot longitudinal data, showing individual tracings for each subject (or other experimental unit).

1.Enter data into an XY data table, formatted with subcolumns for replicates.
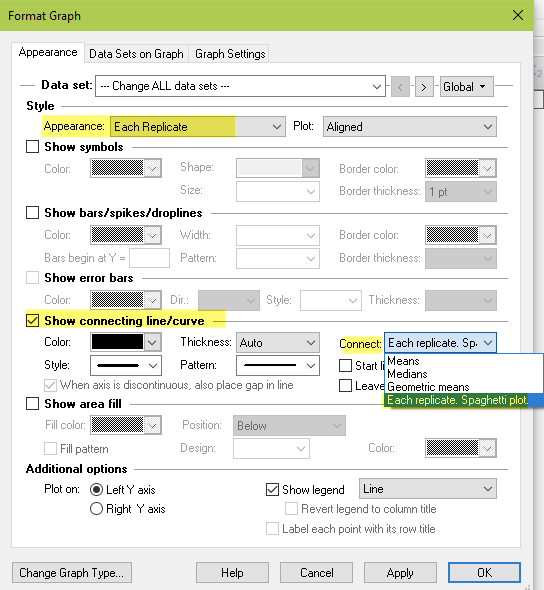
2.At the top of the Format Graph dialog, choose to plot each replicate.
3.Uncheck "Show symbols"
4.Lower on that dialog for connecting lines, choose to connect "Each replicate, Spaghetti plot".