
How should I use the QuickCalcs Post Test Calculator?
Multiple Comparisons: the short version
Two-way ANOVA (and higher order ANOVA designs) often don't answer the specific question of interest in an experiment. In addition to investigating the main effects (and interaction terms) within an ANOVA, researchers are often interested in taking a closer look at comparisons between specific groups within the experiment. Multiple comparisons tests (also called "post tests" or "post hoc tests") can provide information about the comparisons made between these specific groups, while applying statistical corrections to ensure the interpretability of the results.
How should I calculate these multiple comparisons?
Prism provides a wide range of options for performing one-, two-, and even three-way ANOVAs. Additionally, Prism can handle both ordinary as well as repeated measures designs, and is capable of correctly handling missing data through the use of mixed effects models. More importantly, Prism offers a wide range of options for specifying different types of multiple comparisons for each ANOVA design that it offers. Try Prism for 30 days for free, and learn how to perform a one-way, two-way, or three-way ANOVA.
If you use Prism, the multiple comparisons tests you choose will automatically be calculated for you using your selected correction method (Tukey, Bonferroni, Šídák, and more). There’s no need to do extra work to perform these tests using the QuickCalcs Post Test calculator. However, if you’ve already performed a two-way (or higher order) ANOVA using a different statistical software, you can use this calculator to perform the specific multiple comparisons that you’re interested in. Read below for information on how this calculator works and an example of the results that it generates.
Multiple comparisons with the QuickCalcs Post Test Calculator
A very common experimental design involves measuring some response value in different groups related by a small number of categorical variables. For example, measuring response values in men and women, or in mice fed a high-fat diet and mice fed a normal diet. In some cases, you may be investigating multiple categorical variables at the same time. For example, you may want to look at response values from wildtype cells and cells with a specific genetic knockout, with samples of each group grown in both normal culture media as well as serum-depleted culture media. One of the most common methods to analyze the data generated from these sorts of experiments is the analysis of variance - or ANOVA.
Two-way ANOVA, also called two factor ANOVA, determines how a response is affected by two factors. For example, you might measure responses to a drug in both men and women, separated into groups receiving only the drug and a control vehicle, the drug and an agonist, or the drug with an agonist and an antagonist. Some example data from this kind of experiment is shown below.
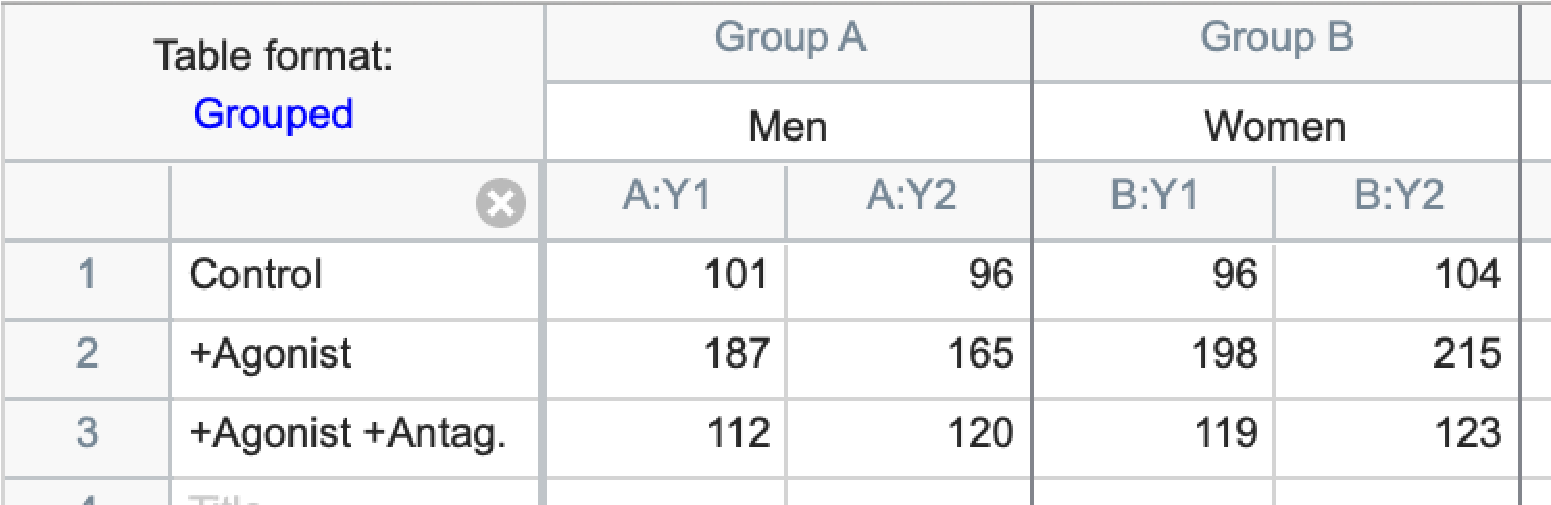
Performing a two-way ANOVA on this data tests whether the column factor (gender in this example) affects the results, whether the row factor (treatment group in this example) affects the results, and whether there is an interaction between these two factors (in this example, the interaction tests whether the treatment group effects are different in men and women).
Multiple comparison post tests let you examine the data in more detail. If you don't have Prism, the QuickCalcs Post Test calculator will allow you to perform multiple comparisons tests that answer a wide range of potential questions. In this example, based on the experimental design, some potential questions may include:
-
For men, is the agonist-stimulated response different than control? (Did the agonist work?)
-
For women, is the agonist-stimulated response different than control?
-
For men, is the agonist response different than the response in the presence of agonist plus antagonist? (Did the antagonist work?)
-
For women, is the agonist response different than the response in the presence of agonist plus antagonist?
-
For men, is the response in the presence of agonist plus antagonist different than control? (Does the antagonist completely block agonist response?)
-
For women, is the response in the presence of agonist plus antagonist different than control?
One could imagine making many more comparisons, but we'll make just these six. The fewer comparisons you make, the more power you'll have to find differences. You must choose the comparisons based on experimental design and the questions you care about. Ideally you should pick the comparisons before you see the data. It is not appropriate to choose the comparisons you are interested in after seeing the data. For each comparison (post test) you want to know:
-
What is the 95% confidence interval for the difference?
-
Is the difference statistically significant (P<0.05)?
To use the web calculator, you need to enter two values from the ANOVA table. The ANOVA table generated by Prism is shown below
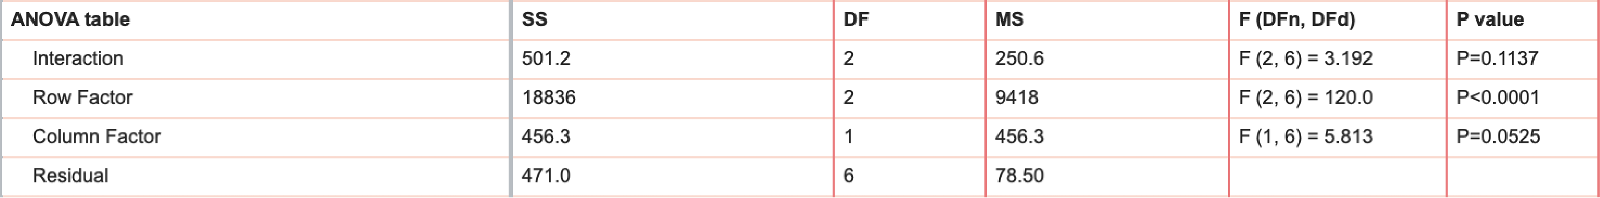
If you performed ordinary (not repeated measures) ANOVA (as in this example) you need to find and enter the mean square (MS) for the residuals (78.5 for this example) and the degrees of freedom for residuals (6 in this example). If you performed repeated measures two-way ANOVA, you need to enter the mean square value for 'subject' and the corresponding number of degrees of freedom. For each post test comparison, you need to enter the mean value in each group as well as the sample size for each group.
Here are the values you enter:
| Comparison | Mean 1 | Mean 2 | N1 | N2 |
|---|---|---|---|---|
| 1: Men. Agonist vs. Control | 176.0 | 98.5 | 2 | 2 |
| 2: Women. Agonist vs. Control | 206.5 | 100.0 | 2 | 2 |
| 3: Men. Agonist vs. Ag+Ant | 176.0 | 116.0 | 2 | 2 |
| 4: Women. Agonist vs. Ag+Ant | 206.5 | 121.0 | 2 | 2 |
| 5: Men. Control vs. Ag+Ant | 98.5 | 116.0 | 2 | 2 |
| 6: Women. Control vs. Ag+Ant | 100.0 | 121.0 | 2 | 2 |
And here are the results:
| Comparison | Significant? (P<0.05?) | t |
|---|---|---|
| 1: Men. Agonist vs. Control | Yes | 8.747 |
| 2: Women. Agonist vs. Control | Yes | 12.020 |
| 3: Men. Agonist vs. Ag+Ant | Yes | 6.772 |
| 4: Women. Agonist vs. Ag+Ant | Yes | 9.650 |
| 5: Men. Control vs. Ag+Ant | No | 1.975 |
| 6: Women. Control vs. Ag+Ant | No | 2.370 |
| Comparison | Mean1-Mean2 | 95% CI of difference |
|---|---|---|
| 1: Men. Agonist vs. control | + 77.5 | + 43.3 to + 111.7 |
| 2: Women. Agonist vs. control | + 106.5 | + 72.3 to + 140.7 |
| 3: Men. Agonist vs. Ag+Ant | + 60.0 | + 25.8 to + 94.2 |
| 4: Women. Agonist vs. Ag+Ant | + 85.5 | + 51.3 to + 119.7 |
| 5: Men Control vs. Ag+Ant | -17.5 | -51.7 to + 16.7 |
| 6: Women Control vs. Ag+Ant | -21.0 | -55.2 to + 13.2 |
The calculations account for multiple comparisons. This means that the 95% confidence level applies to all the confidence intervals. You can be 95% sure that all the intervals include the true value. The 95% probability applies to the entire family of confidence intervals, not to each individual interval. Similarly, if the null hypothesis were true (that all groups really have the same mean, and all observed differences are due to chance) there will be a 95% chance that all comparisons will be not significant, and a 5% chance that any one or more of the comparisons will be deemed statistically significant with P< 0.05.
For the sample data, we conclude that the agonist increases the response in both men and women. Adding antagonist (plus agonist) decreases the response down to a level that is indistinguishable from the control response.