This page describes the steps necessary to perform Kaplan-Meier survival analysis within Prism. To learn more about the background and mathematics involved in the analysis that Prism performs, check out this section of the guide.
Create a survival data table
From the Welcome or New Table dialog, choose the Survival tab. If you aren’t ready to enter your own data yet, choose “Start with sample data to follow a tutorial” and select one of the tutorial data sets.
Enter the survival times
Enter the elapsed time to the event of interest for each subject on a separate row in the table, following these guidelines:
•Enter the time until censoring or the event of interest (death, or whatever other event you’re tracking) in the X column. Note that if starting with your own data, Prism offers two choices for entering elapsed times:
▪Enter elapsed time as number of days (or months…). For this option, use any convenient unit, such as days or months. Note that these are elapsed times, and so time zero does not need to be specified
▪Enter a starting and ending date. For this option, a calendar date must be entered for the starting (zero) time and ending time for each observation. Prism will calculate the difference between these two dates as the elapsed observation time for the observation
•Optionally, row titles can be used to identify each subject/participant
•Enter “1” into the Y column for rows in which the subject experienced the event of interest at the time or end date shown in the X column. Enter “0” into rows where the subject was instead censored at this time. Note that every row must have either a 0 or a 1 in a single Y column. Any row without a 1 or 0 in any Y column will be omitted from the analysis
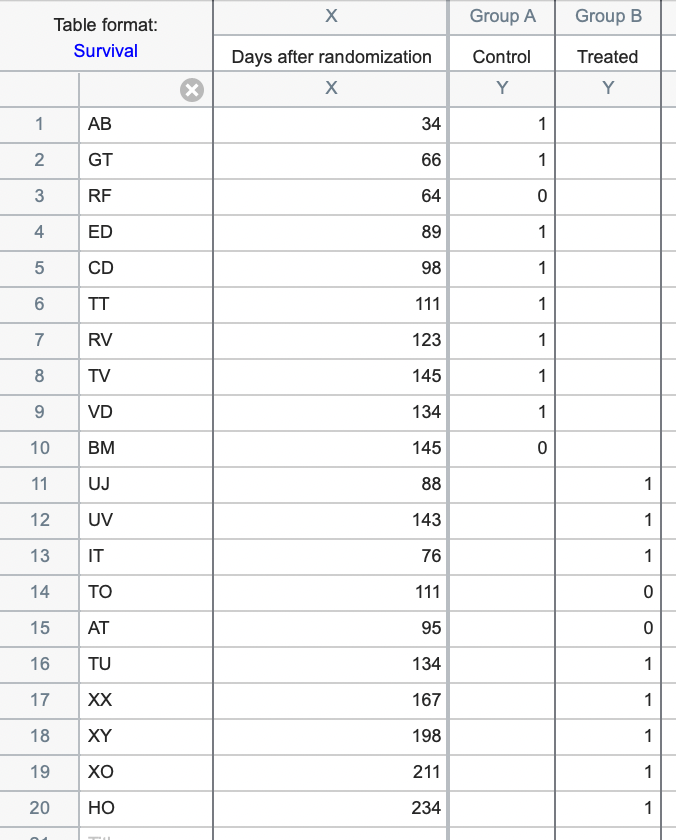
•Enter subjects belonging to different treatment groups into different Y columns (one Y column for each group). Each row should contain a value in only one Y column. For example, if the first 10 rows correspond to members of a control group, while the next 10 rows correspond to members of a treatment group, the data may look something like this:
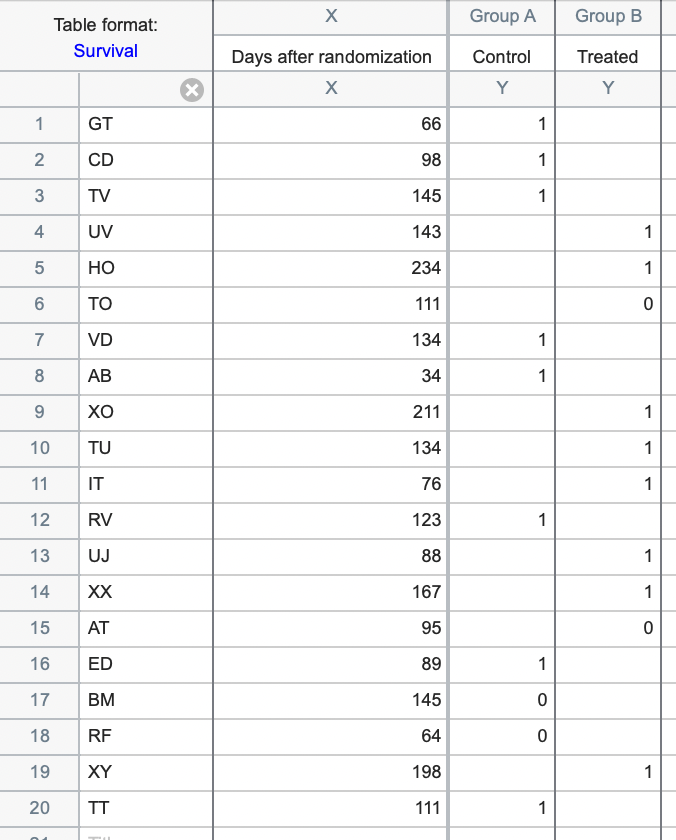
However, note that there’s no reason that the groups have to be separated this way. As long as the correct elapsed time is associated with the correct outcome (1 or 0) in the correct group (column) on the same row, the analysis results will be the same. For example, the data above, could also be entered like this:
•It’s recommended to take advantage of known relationships in the data to help keep the data organized properly. For example, if the treatment groups are intrinsically ordered (for example, increasing dosages) maintain that order when entering data. Ensure that the progression of column A to column B to column C follows the natural order of the groups. If there is no intrinsic order, they can be arranged in any order
•A quick way to ensure that the data were entered correctly is to count the number of rows with data. This number should be equal to the number of subjects or participants were included in the study
Entering data for survival analysis can be confusing at first. See answers to common questions, an example of a clinical study, and an example of an animal study to become more familiar with this process.
View the graph and results
It’s important to note that survival analysis works differently than other analyses in Prism. When a survival data table is created, Prism automatically analyzes the data. There’s no need to initiate an analysis using the Analyze toolbar button or Analyze menu. When you are done entering data, go to the graph to see the completed survival curve (Prism will create one curve for each group/column of data that was entered). If data for more than one group was entered, you can also go to the results sheet to view the results of the logrank test, which compares the generated curves.
Interpreting results: Kaplan-Meier curves
Interpreting results: Comparing two Kaplan-Meier curves
Interpreting results: Comparing three or more Kaplan-Meier curves
Analysis checklist: Kaplan-Meier survival analysis