The regression guide explains how to fit a line or curve to your data. But sometimes you just want to add a line of identity -- a line where every point has equal X and Y coordinates. Prism offers three ways to do this:
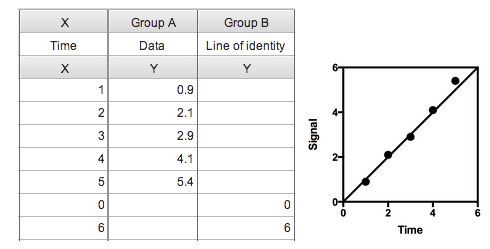
•Enter a data set on your data table with only two points defining the two ends of the line you want to draw. In both cases X and Y will have the same value. You can put these points on the same data table as your data. Just put the Y values into a new Y column. Place the X values below the X for your main data set, and make sure the Y values are in the same row (many rows above that will be blank). When you look at the graph, that new data set will first show as only two data points. Double click on one to bring up the Format Graph dialog. Uncheck the option to show symbols, and check the option to show a connecting line.
•Use the analysis to plot a function. From the graph, click Analyze, and at the bottom of the analyze dialog go to the Generate a Curve folder and choose the Plot a function analysis. Choose a straight line (from the Lines folder of equations), enter the first and last X values you want to plot the line between, and then go to the third tab of that dialog and enter values for the Y intercept (probably 0.0) and slope (probably 1.0).
•Use the line drawing tool to draw the line manually.
The first method is probably the most straightforward. The second method is great in that it can be extended to other functions besides straight lines. We don't recommend the third method, but it is a quick and easy way to produce the line for someone who doesn't want to think about math.