The meaning of r2
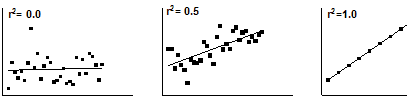
The value r2 is a fraction between 0.0 and 1.0, and has no units. An r2 value of 0.0 means that knowing X does not help you predict Y. There is no linear relationship between X and Y, and the best-fit line is a horizontal line going through the mean of all Y values. When r2 equals 1.0, all points lie exactly on a straight line with no scatter. Knowing X lets you predict Y perfectly.
How r2 is computed
This figure demonstrates how Prism computes r2.
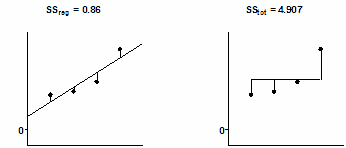
The left panel shows the best-fit linear regression line This lines minimizes the sum-of-squares of the vertical distances of the points from the line. Those vertical distances are also shown on the left panel of the figure. In this example, the sum of squares of those distances (SSreg) equals 0.86. Its units are the units of the Y-axis squared. To use this value as a measure of goodness-of-fit, you must compare it to something.
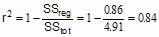
The right half of the figure shows the null hypothesis -- a horizontal line through the mean of all the Y values. Goodness-of-fit of this model (SStot) is also calculated as the sum of squares of the vertical distances of the points from the line, 4.907 in this example. The ratio of the two sum-of-squares values compares the regression model with the null hypothesis model. The equation to compute r2 is shown in the figure. In this example r2 is 0.8428. The regression model fits the data much better than the null hypothesis, so SSreg is much smaller than SStot, and r2 is near 1.0. If the regression model were not much better than the null hypothesis, r2 would be near zero.
You can think of r2 as the fraction of the total variance of Y that is "explained" by variation in X. The value of r2 (unlike the regression line itself) would be the same if X and Y were swapped. So r2 is also the fraction of the variance in X that is "explained" by variation in Y. In other words, r2 is the fraction of the variation that is shared between X and Y.
In this example, 84% of the total variance in Y is "explained" by the linear regression model. The variance (SS) of the data from the linear regression model equals only 16% of the total variance of the Y values (SStot).
How is r2 useful?
Many people find r2 useful in this way: When you run a series of experiments, you want to make sure that today's experiment is consistent with other runs of the experiment. For example, if you always get r2 between 0.90 and 0.95 but today you got r2=0.75, then you should be suspicious and look carefully to see if something went wrong with the methods or reagents used in that particular experiment. And if a new employee brings you results showing r2 of 0.99 using that same system, you should look carefully at how many"outliers" were removed, and whether some data were made up.
Why Prism doesn't report r2 in constrained linear regression
Prism does not report r2 when you force the line through the origin (or any other point), because the calculations would be ambiguous. There are two ways to compute r2 when the regression line is constrained. As you saw in the previous section, r2 is computed by comparing the sum-of-squares from the regression line with the sum-of-squares from a model defined by the null hypothesis. With constrained regression, there are two possible null hypotheses. One is a horizontal line through the mean of all Y values. But this line doesn't follow the constraint -- it does not go through the origin. The other null hypothesis would be a horizontal line through the origin, far from most of the data.
Because r2 is ambiguous in constrained linear regression, Prism doesn't report it. If you really want to know a value for r2, use nonlinear regression to fit your data to the equation Y=slope*X. Prism will report r2 defined the first way (comparing regression sum-of-squares to the sum-of-squares from a horizontal line at the mean Y value).
Upper or lower case?
With linear regression, it is conventional to use the abbreviation r2. With nonlinear regression, the convention is to use R2. There appears to be no reason for this distinction.