This equation is used when X values are concentrations or doses. Use a related equation when X values are logarithms of concentrations or doses.
Introduction
The standard dose-response curve is sometimes called the four-parameter logistic equation. It fits four parameters: the bottom and top plateaus of the curve, the EC50 (or IC50), and the slope factor (Hill slope). This curve is symmetrical around its midpoint. To extend the model to handle curves that are not symmetrical, the Richards equation adds an additional parameter, S, which quantifies the asymmetry. This equation is sometimes referred to as a five-parameter logistic equation, abbreviated 5PL.
Step by step
Create an XY data table. Enter the concentration of the agonist into X. Enter response into Y in any convenient units.
From the data table, click Analyze, choose nonlinear regression, and choose the panel of equations: Dose-Response -- Special, X is concentration. Then choose Asymmetrical (five parameter), X is concentration.
Consider constraining the Hill Slope to a constant value of 1.0 (stimulation) or -1 (inhibition).
Also consider whether Bottom or Top should be fixed to constant values, or shared between data sets.
Model
Denominator = (1+(2^(1/S)-1)*((EC50/X)^HillSlope))^S
Numerator = Top - Bottom
Y = Bottom + (Numerator/Denominator)

Interpret the parameters
Bottom and Top are the plateaus at the left and right ends of the curve, in the same units as Y.
EC50 is the concentrations that give half-maximal effects, in the same units as X.
HillSlope is the unitless slope factor or Hill slope. Consider constraining it to equal 1.0 (stimulation) or -1 (inhibition).
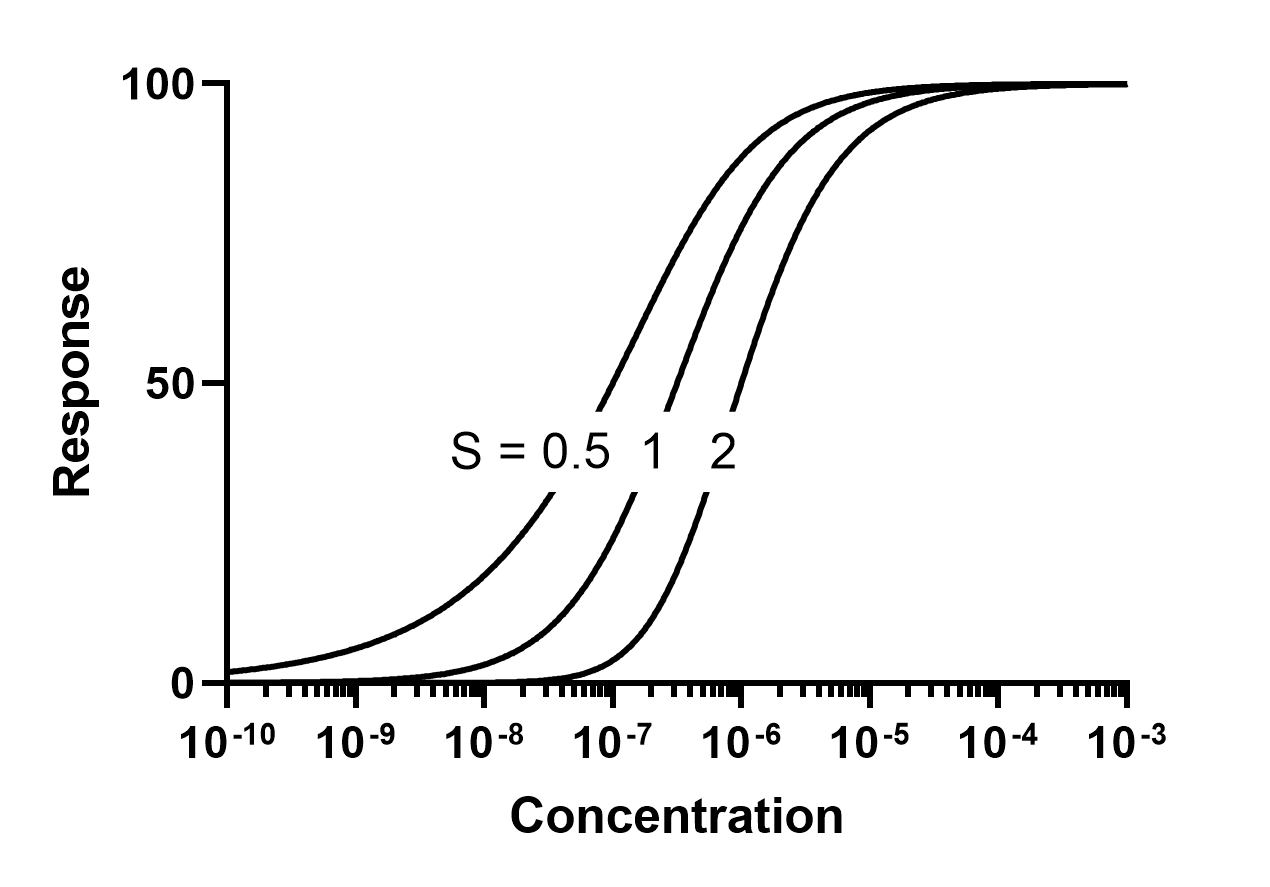
S is the unitless symmetry parameter. If S=1, the curve is symmetrical and identical to the standard dose-response equation. If S is distinct than 1.0, then the curve is asymmetric as shown below.
Notes
•If your goal is to obtain meaningful best-fit parameters, then you'll need lots of high quality data. It is very hard to fit both slope and asymmetry with tight confidence intervals. If your goal is just to interpolate unknowns from a standard curve, the width of the confidence intervals of the parameters doesn't really matter. What you want is a curve that follows the data, and in some cases an asymmetrical five parameter model does so better than a four parameter model.
•It can be tricky to get a good fit to the 5PL. See this discussion.
•Other formulations of asymmetrical dose-response curves have been developed. For example, Ricketts and Head developed a model for use in baroreflex studies.
•Bindslev has written a lengthy on-line text, Drug-Acceptor Interactions. Chapter 10, Hill in Hell discusses many models of dose-response curves, including asymmetrical ones.
•Liao and Liu have done simulations that show the advantage of fitting the EC50 rather Xb.
•Gottschalk and Dunn review the properties of the 5Pl.
•The equation built-in to Prism is only one of several ways to express a five parameter concentration-response curve.
References
Bindslev, Drug-Acceptor Interactions. Chapter 10, Hill in Hell
Cumberland, W.N., Fong, Y., Yu, X., Defawe, O., Frahm, N., and De Rosa, S. (2014). Nonlinear Calibration Model Choice between the Four and Five-Parameter Logistic Models. Journal of Biopharmaceutical Statistics 25: 972–983.
Giraldo, J., Vivas, N. M., Vila, E. & Badia, A. Assessing the (a)symmetry of concentration-effect curves: empirical versus mechanistic models. Pharmacol Ther 95, 21–45 (2002).
Gottschalk, P. G. & Dunn, J. R. The five-parameter logistic: a characterization and comparison with the four-parameter logistic. Anal Biochem 343, 54–65 (2005).
Liao, J.J.Z, Liu, R., Re-parameterization of five-parameter logistic function, Journal of Chemometrics, 23:248-253 (2009)
Ricketts, J. H. and Head, G.A. A five-parameter logistic equation for investigating asymmetry of curvature in baroreflex studies. Am. J. Physiology, 277: R441-54 (1999)