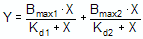
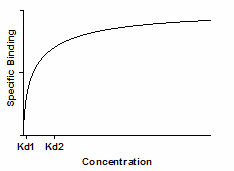
This equation is an extension of the one site binding curve. It shows the binding of a ligand to two receptors with different affinities (different Kd values). It also describes the enzyme activity as a function of substrate concentration when two isozymes are present. The curve in the example has Kd values that differ by a factor of ten, with equal Bmax values. Even with such a large difference between Kd values, the curve is not obviously biphasic.