Introduction
A dissociation binding experiment measures the “off rate” for radioligand dissociating from the receptor. Initially ligand and receptor are allowed to bind, perhaps to equilibrium. At that point, you need to block further binding of radioligand to receptor so you can measure the rate of dissociation. There are several ways to do this:
•If the tissue is attached to a surface, you can remove the buffer containing radioligand and replace with fresh buffer without radioligand.
•Spin the suspension and resuspend in fresh buffer.
•Add a very high concentration of an unlabeled ligand. If this concentration is high enough, it will instantly bind to nearly all the unoccupied receptors and thus block binding of the radioligand.
•Dilute the incubation by a large factor, at least 100 fold dilution. This will reduce the concentration of radioligand by that factor. At such a low concentration, new binding of radioligand will be negligible. This method is only practical when you use a fairly low concentration of radioligand so its concentration after dilution is far below its Kd for binding.
You then measure binding at various times after that to determine how rapidly the radioligand falls off the receptors.
Step by step
Create an XY data table. Enter time into X, and total binding into Y. If you have several experimental conditions, place the first into column A, the second into column B, etc.
From the table of specific binding, click Analyze, choose nonlinear regression, choose the panel of Kinetics Binding equations, and choose Dissociation - One phase exponential decay .
Model
Y=(Y0-NS)*exp(-K*X) + NS
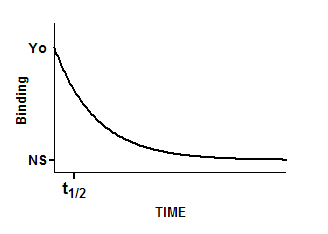
Interpret the parameters
Y0 is the binding at time zero, in the units of the Y axis.
NS is the binding (nonspecific) at infinite times, in the units of the Y axis.
K is the rate constant in inverse units of the X axis. The half-life equals the ln(2) divided by K.
Checking for cooperativity
If the law of mass action applies, binding of a ligand to one binding site does not alter the affinity of another binding site. This also means that dissociation of a ligand from one site should not change the dissociation of ligand from other sites. To test this assumption, compare the dissociation rate after initiating dissociation by infinite dilution with the dissociation rate when initiated by addition of a large concentration of unlabeled drug. If the radioligand is bound to multiple noninteracting binding sites, the dissociation will be identical in both experimental protocols as shown in the left figure below. Note that the Y axis is shown using a log scale. If there were a single binding site, you would expect the dissociation data to appear linear on this graph. With two binding sites, the graph is curved even on a log axis.
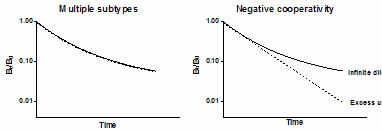
The right figure shows ideal dissociation data when radioligand is bound to interacting binding sites with negative cooperativity. The data are different depending on how dissociation was initiated. If dissociation is initiated by infinite dilution, the dissociation rate will change over time. The dissociation of some radioligand will leave the remaining ligand bound more tightly. When dissociation is initiated by addition of cold drug, all the receptors are always occupied by ligand (some hot, some cold) and dissociation occurs at its maximal unchanging rate.