Two sets o equations
Prism provides two sets of dose-response equations.
•One set assumes you have entered concentrations (or doses) as X.
•The other set assumes you entered the logarithms of concentration or dose.
It matters a lot that you pick an equation that corresponds to your data. Otherwise the fit will not be helpful.
Note that Prism's nonlinear regression "sees" a table of XY values, and fits that. The nonlinear regression part of Prism does not "see" the graph you made. If you entered X values as concentrations, they are still concentrations even if you graph those data on a graph where the X axis uses a logarithmic scale. Stretching the axis to a logarithmic scale does not change the data. The X values are still concentrations, not logarithms of concentrations.
How to transform your X values from concentrations to logarithm of concentrations
If you entered actual doses or concentrations, instead of their logarithms, but want to use an equation that assumes the X values are logarithms, use Prism to transform the X values.
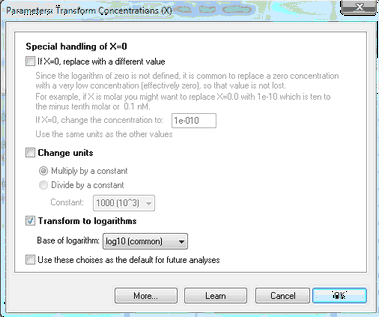
1.From the data table, click Analyze and then choose Transform Concentrations (X), which is the second analysis listed on the Analyze dialog.
2.On the dialog, check the option to transform X to logarithms. Base 10 (common) logarithms are used most commonly.
3.If any of your X values are 0.0, use the option at the top of the dialog to change these to some small concentration. The reason for this is that the logarithm of zero is not defined.
Using e notation
Don't mix up e notation with logarithms.
If you enter "1e-9", that is exactly the same as entering "0.000000001". To enter the logarithm, enter "-9".