1. Create the data table
From the Welcome or New Table dialog, choose to create an XY data table, and select the sample data set: RIA or ELISA. Interpolate unknowns from sigmoidal curve.
2. Inspect the data
The sample data may be partly covered by a floating note explaining how to fit the data (for people who are not reading this help page). You can move the floating note out of the way, or minimize it.
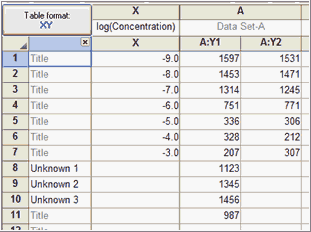
The first seven rows contain the standard curve, in duplicate. Below that are three unknown values. These have a Y values that you measured, but no X. The goal of this analysis is to interpolate the corresponding X values (concentrations) for these unknowns. Note that three of the four unknowns are labeled, so you can later match up the results with the labels.
Why are X values negative? Because in this example, the X values are the logarithm of concentrations expressed in molar. So a concentration of 1 micromolar (10-6 Molar) would be entered as -6.
3. View the graph
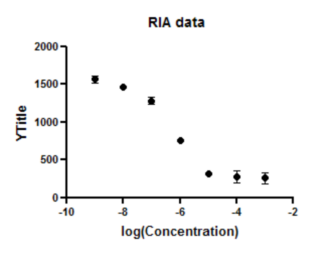
The graph Prism makes automatically is fairly complete. You can customize the symbols, colors, axis labels, etc. You can also choose to plot the individual duplicates rather than plot the means. Since the unknowns have no X value, they are not included on the graph.
4. Choose the standard curve analysis
Click the Analyze button and from the list of XY analyses choose: Interpolate a Standard Curve.
Alternatively, you can click the “Interpolate a standard curve” button right on top of the Analyze button.
5. Choose a model
Choose the equation: Sigmoidal, 4PL, X is log(Concentration). Note that 4PL means four parameter logistic, which is another name for this kind of equation.
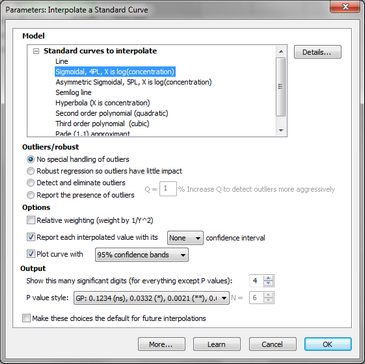
For this example, leave all the other settings to their default values.
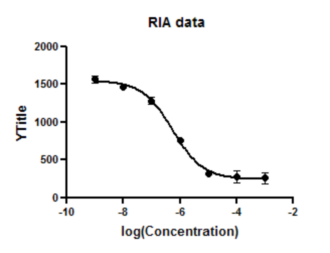
Click OK to see the curves superimposed on the graph.
6. Inspect the results
The results appear on several pages.
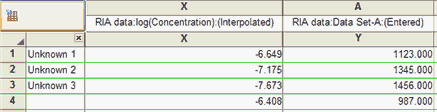
The first page shows you the interpolated values.
The second page is the table of results for the overall curve fit. It tabulates the best-fit values of the parameters and much more. For this example, we aren't too interested in these results.
7. Transform the results
The X column of the results table has the interpolated values we want. These are in the same units as the X values, so are the logarithm of concentration. Prism can transform these values to concentration units.
Click the Analyze button and choose Transform at the top of the Analyze dialog.
On the Transform dialog check the option to transform X values and choose the transform X=10^X
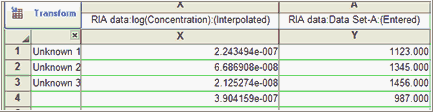
Now the X column is in molar concentration units. Note that the column title hasn't changed. Prism isn't smart enough to adjust the column titles when you transform data.
Click and edit the column title to "Concentration (M)".