1. Create a data table
From the Welcome or New Table dialog, choose to create XY data table.
If you are just getting started, choose the sample data: Linear regression -- Compare slopes.
If you are entering your own data, choose a to enter a single Y value for each point (no replicates, no error values).
2. Enter data
If you enter Y values for several data sets (column A, B and C), Prism will report regression results for X vs. YA, for X vs. YB, and for X vs. YC.
3. Analysis choices
Click Analyze and choose Deming regression from the list of XY analyses.
Most of the dialog is self-explanatory. The choices on top are the hardest to understand, but also are the most important as the calculations depend on knowing relative magnitude of the errors in X and Y.
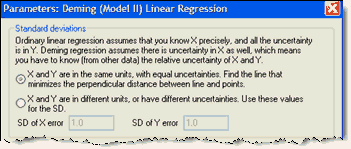
X and Y have equal uncertainty
If you are comparing two analytical methods, X and Y, assessed in the same units, you will probably find it reasonable to assume that both share the same standard deviation. In this case, check the first option. There is no need to estimate that standard deviation. It is enough to declare that X and Y have equal standard deviations. In this case, Deming regression minimizes the sum of the squares of the perpendicular distances of the points from the line. This is also called orthogonal regression.
X and Y have different uncertainties
If you are not willing to assume that X and Y have the same amount of uncertainty, then you need to enter the SD of each. Enter the SD of X values in the same units as X values are entered, and the SD of Y values in the same units as Y values are entered. Don't enter the SD of all X (or Y) values you enter. Enter the average SD (determined separately) of repeated measurements of X and Y.
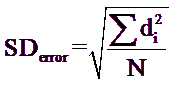
How do you know what values to enter? To assess the uncertainty (error) of a method, collect duplicate measurements from a number of samples using that method. Calculate the standard deviation of the error using the equation below(1), where each di is the difference between two measurements of the same sample (or subject), and N is the number of measurements you made (N equals twice the number of samples, since each sample is measured twice).
Compute the SD of the error for each method or variable (X and Y), enter the two SDerror values into the Deming regression analysis dialog, and Prism will fit the line for you. If the X variable has a much smaller SD than the Y value, the results will be almost identical to standard linear regression.
If you try to compare Prism’s results with those of another program or book, you may encounter the variable λ (lambda), which quantifies the inequality between X and Y errors.
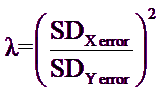
Prism requires you to enter individual SD values, but uses these values only to calculate λ, which is then used in the Deming regression calculations. If you know λ, but not the individual SD values, enter the square root of λ as the SD of the X values, and enter 1.0 as the SD of the Y error. The calculations will be correct, since Prism uses those two values only to compute λ.
Reference
1. PW Strike, Statistical Methods in Laboratory Medicine, ISBN:0750613459. Equation 8.15.