Choices when entering data with replicates in subcolumns
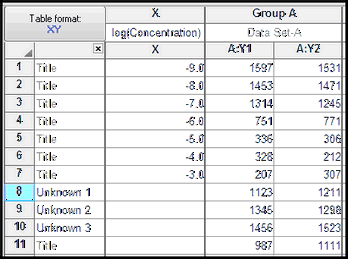
It is common to enter replicate values for the unknowns, as shown below.
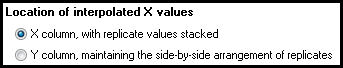
Since Prism's results tables cannot be configured to put side-by-side replicates in the X column, you have two choices for how to organize the results. These choices are available at the bottom of the Output tab of the nonlinear regression dialog.
Place computed unknown values into the X column, with replicate values stacked
In this case, Prism creates two tabs of results. The interpolation is the same for both tables. Prism interpolates each replicate value individually.
The first tab, Interpolated Mean X Values, shows the mean of the Y values you entered and the mean of the interpolated X values. The X column shows the concentrations (or logarithm of concentrations) to match the data you entered.
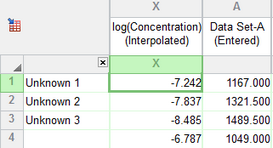
The second tab, Interpolated X replicates, shows individual replicate values for the interpolated results. The X column maintains the same meaning as it does in the data table you entered. To do so, with only a single X column, requires that the replicates be stacked.
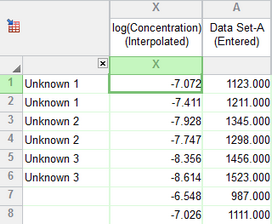
Place computed unknown values into a Y data set, maintaining the side-by-side arrangement of replicates.
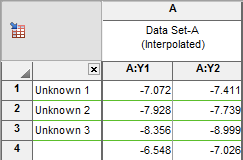
When you make this choice, the interpolated values appear in the Y column, and there is no X column. You can view the interpolated values, with their name (if you entered row titles). But the Y values you entered are not shown.
The first page shows the mean values. The second page shows the interpolated values in side-by-side replicates, to match the format you entered them. Even though these values are interpolated X values, note that the results are in the Y column.