Introduction
Kinetics experiments can determine the dissociation and association rate constants (off-rate and on-rate) of an unlabeled compound. Add labeled and unlabeled ligand together and measure the binding of the labeled ligand over time. Fit to the appropriate model described below, constraining the rate constants of the labeled ligand to constant values determined from other experiments, and fit the rate constants of the unlabeled compound.
Using only a single concentration of labeled and radioligand, it is very hard to determine the rate constants with any reasonable precision. But measure the kinetics at two (or more) concentrations of the unlabeled ligand, and the results are much more precise.
Step by step
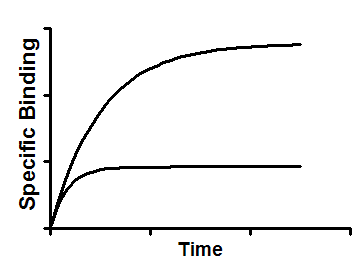
Create an XY data table. Enter time in minutes into X, and specific binding in cpm into Y. Enter the binding for one concentration of of the unlabeled ligand in column A, and another concentration in column B, etc.. Enter the concentrations, in nM, into the column titles.
From the table of specific binding, click Analyze, choose nonlinear regression, choose the panel of Kinetics Binding equations, and choose Kinetics of competitive binding.
Constrain k1 and k2 to constant values determined from kinetic binding experiments. k1 is the association rate constant of the hot ligand in M-1 min-1 and k2 is its dissociation rate constant in units of min-1.
Also constrain L to be a constant value equal to the concentration of labeled ligand in nM.
I is constrained to be a column constant whose value comes from the column titles.
Model
KA = K1*L*1E-9 + k2
KB = K3*I*1e-9 + K4
S=SQRT((KA-KB)^2+4*K1*K3*L*I*1e-18)
KF = 0.5 * (Ka + KB + S)
KS = 0.5 * (KA + KB - S)
DIFF=KF - KS
Q=Bmax*K1*L*1e-9/DIFF
Y=Q*(k4*DIFF/(KF*KS)+((K4-Kf)/KF)*exp(-KF*X)-((K4-KS)/KS)*exp(-KS*X))
Interpret the parameters
k3 is the association rate constant of unlabeled ligand in M-1 min-1.
k4 is the dissociation rate constant of unlabeled ligand in min-1.
Bmax is the total number of receptors. Either leave as a variable or set to a constant you know from other experiments. The Bmax is the maximum binding at equilibrium with a very high concentration of radioligand. It is usually much larger than any binding seen in the experiment.
All three parameters are constrained to be shared, so Prism fits one value of each of the three parameters for all the data sets.
Notes
•This equation does not account for ligand depletion. It assumes that only a small fraction of radioligand binds to receptors, so that the free concentration of radioligand is very close to the added concentration.
•This method will only give reliable results if you have plenty of data points at early time points.
•The ratio K4/K3 is the equilibrium dissociation constant of the cold ligand in Molar. You should compare this value (determined via kinetics) with the same value determined by equilibrium competition.
Extensions to this model
Pharmechanics has adapted this equation to extend the analysis of the kinetics of competitive binding in two ways:
•To work with different orders of addition of receptor, hot compound and cold compound. The kinetics of competitive binding equation was designed for the most commonly-used assay format, in which receptor is exposed to both ligands simultaneously, i.e. receptor is added last. There are occasions when the ordering of reagent addition is different, for example preincubation of receptor with unlabeled compound, or with labeled ligand
•To work with rapidly-dissociating compounds. The kinetics of competitive binding equation was developed for unlabeled ligands that dissociate sufficiently slowly that the fit provides reasonable estimates of the kinetic parameters. When the unlabeled ligand dissociates rapidly, an ambiguous fit often results because the ligand equilibrates so rapidly that the kinetic assumption no longer applies.In this scenario, the data can be better fit by an equation that assumes the unlabeled ligand rapidly equilibrates with the free receptors.
Learn more and download a Prism file here.
Reference
This method was described by Motulsky and Mahan in Molecular Pharmacology 25:1-9, 1984.