Introduction
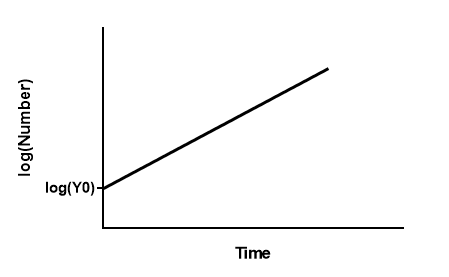
With exponential growth, the population keeps growing forever with a constant doubling time. If you plot the logarithm of population as Y (instead of the population itself), the graph is linear. When you fit an exponential model, you want the scatter to be about the same at all time points. This assumption is often more likely to be true of you fit the log of concentration rather than concentration.
Step by step
Create an XY table. Enter time values into X and the logarithm of population values into Y. The natural logarithm is use most often for these kinds of data. If you use another logarithm (for example, base 10 or base 2), the resulting curve will still be a straight line. However, the interpretation of the parameters will be wrong (specifically, the doubling time reported by Prism can only be interpreted correctly if the Y values entered in the data table represent the natural logarithm of the population values).
After entering data, click Analyze, choose nonlinear regression, choose the panel of growth equations, and choose Log of exponential growth.
Consider whether logY0 should be constrained to a fixed values.
Model
Y=logY0 + k*X
Interpret the parameters
logY0 is the starting population in the same logarithmic units as Y
k is the rate constant (inverse of the X time units).
DoublingTime is the time needed for the population to double. It is calculated as ln(2)/k.
Relationship between this equation and exponential (Malthusian) growth
If the data were transformed using the natural logarithm, then k in this fit is equivalent to k in the exponential (Malthusian) growth equation and the logY0 here is equivalent to the logarithm of Y0 in the exponential equation.
But the two values of k won't usually be identical. The Exponential growth equation is more appropriate when the scatter of data around the curve is the same at all time points. The log of exponential growth equation is more appropriate when the scatter of data around the line is the same at all time points.