Prism can plot the residuals in four distinct ways:
X axis |
Y axis |
|
Residual plot |
Predicted Y value |
Residual |
Homoscedasticity plot |
Predicted Y values |
Absolute value of residual |
QQ plot |
Actual residual |
Predicted residual if residuals are sampled from a Gaussian distribution |
Residual vs. row number |
Row number |
Residual |
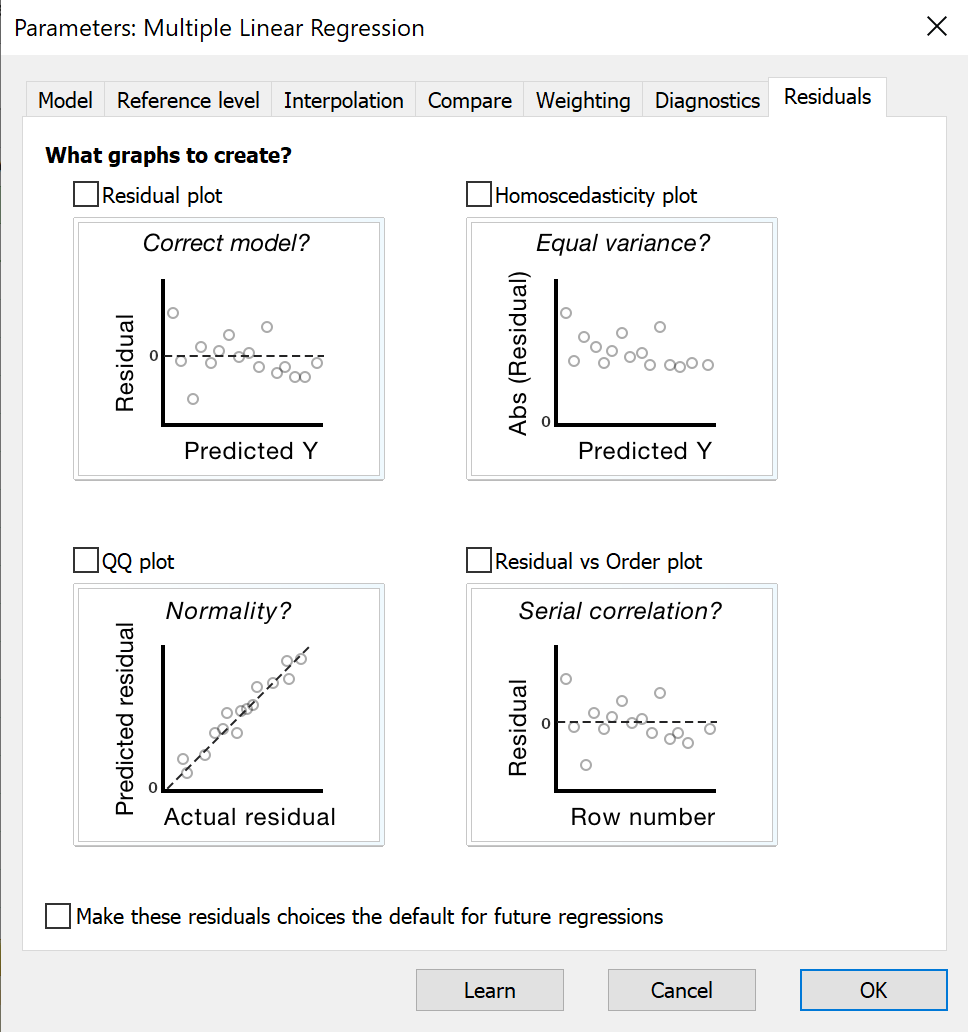
•The residual plot is used most often. For each row of data, Prism computes the predicted Y value from the regression equation and plots this on the X axis. The Y axis shows the residual. If the data follow the assumptions of multiple regression, you shouldn't see any clear trend. The size of the residuals should not be related to the predicted Y values.
•The homoscedasticity plot is the same, except the Y axis shows the absolute value of the residuals. This means all the Y values are positive, showing the length of the residual. It is a little easier to look for a relationship between predicted Y and the size of the residuals when shown this way. It helps you assess whether the assumption of homoscedasticity is valid. This is the assumption that absolute value of the residual is not related to the Y values. If you see larger absolute residuals when Y is larger, then this assumption is dubious. You might want to consider unequal weighting of the points.
•The QQ plot graphs the actual residuals on the X axis vs. the predicted residuals on the Y axis. This prediction is based on the assumption that the residuals were sampled from a Gaussian distribution. If the assumption of normality is met, you'd expect the points on this graph to form a straight line, near the line of identity. Various programs plot QQ plots in various ways. Prism always plots the actual residual vs. predicted and doesn't show percentiles or quantiles.
•Plotting residuals vs. row numbers only makes sense when the order of rows is meaningful. Observing a trend that the residuals get smaller (or larger) with increasing row number may help you make sense of your data.
If you choose unequal weighting, the residual plots all show the weighted residual, not the actual residual.
You can read more about the various kinds of residual plots in the discussion of residuals from nonlinear regression.