Reparameterizing an equation does not change the best-fit curve
You want to fit the sigmoidal enzyme kinetics data to a standard model. But there are two forms of that model that are commonly used:
Y=Vmax*X^h/(Khalf^h + X^h)
Y=Vmax*X^h/(Kprime + X^h)
The two are equivalent, with Kprime equal to Khalfh , so the two fits will generate exactly the same curve, with the same sum-of-squares, the same R2, and the same numbers of degrees of freedom. Even though the two equations express the same model, they are written differently. The fancy term is that they are parameterized differently.
They both fit Vmax (the maximum activity extrapolated to very high concentrations of substrate) and h (Hill slope, describing the steepness of the curve). But one model fits Khalf (the concentration needed to obtain a velocity half of maximal) and the other fits Kprime (a more abstract measure of substrate action).
Which model is preferred?
One way to choose between the two models is to match other text books and papers, so your results can easily be compared to others. Another approach is to choose the form that fits the way you think. For this example, if you prefer to think graphically, choose the Khalf. If you think mechanistically, choose Kprime.
But the choice can be more than a matter of convenience and convention. The choice of model can determine the accuracy of the confidence intervals. Read on to see why.
Distribution of parameters are not always symmetrical
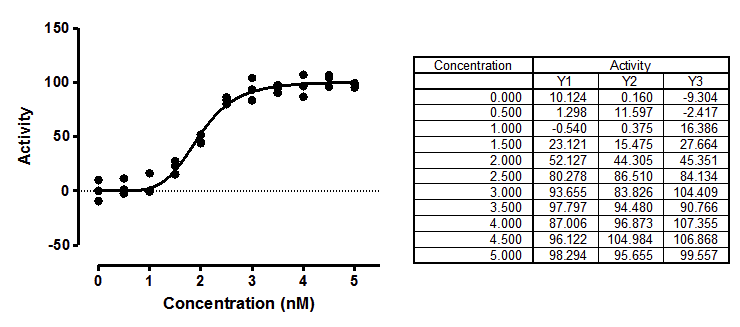
Simulations can determine parameter symmetry. I simulated sigmoidal enzyme kinetics using Vmax=100, h=5, Kprime=25, and Gaussian scatter with a SD equal to 7.5. The X values matched those in the figure above, with triplicate Y values at each X. Prism can do such simulations easily. Using Prism's Monte Carlo analysis, I repeated the simulations 5000 times, fit each curve to both forms of the models, and tabulated the best-fit values of Kprime and Khalf, and computed the skewness of each.
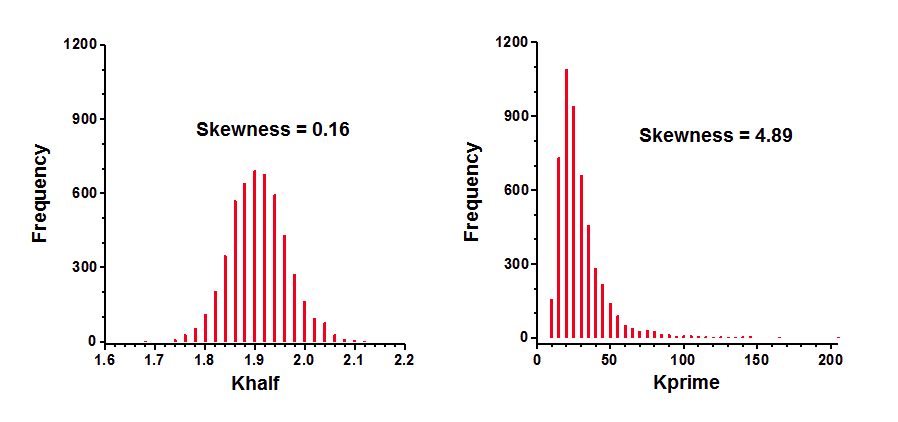
The distribution of Khalf is quite symmetrical and looks Gaussian. Accordingly, its skewness is close to zero. In contrast, the distribution of Kprime is quite skewed. Note that a few of the simulation data sets had best-fit values of Kprime greater than 100. The skewness value (4.89) confirms what is obvious by inspection -- the distribution is far from symmetrical.
Coverage of the symmetrical asymptotic confidence intervals
Prior versions of GraphPad Prism, like almost all nonlinear regression programs, computes the confidence interval of a best-fit parameters so the interval is symmetrical around the best fit values. If the uncertainty of a parameter is truly symmetrical, then these confidence intervals can be interpreted at face value. If the uncertainty is not symmetrical, then the confidence interval will not be accurate.
Ideally, a confidence interval is easy to interpret. A 95% CI has a 95% chance of including the true value of the parameter, and a 5% chance of missing it. When analyzing real data, we never know the value of the true parameter, so never know if the interval includes it or not. But when you simulate data, you know the true values of the parameters, so can quantify the coverage of the confidence intervals. I set up the same simulations mentioned above, fit each data set to both equations, and tabulated whether each confidence interval included the true parameter value or not. This table shows the fraction of 5,000 simulations where the confidence interval did not include the true parameter value (25 for Kprime, and 1.9037 for Khalf).
"95% CI" |
"99% CI" |
|
Ideal |
5.0% |
1.0% |
Kprime |
8.8% |
4.8% |
Khalf |
5.1% |
1.0% |
These results show that Khalf is well behaved, as expected given its symmetry (see above). The 95% confidence interval is expected to miss the true value in 5.0% of the simulations. In fact, it happened 5.1% of the time. Similarly, the 99% CI is expected to miss the true value in 1.0% of the simulations, which is exactly what happened. In contrast, Kprime is less well behaved. The intervals computed to be 95% confidence intervals were not wide enough so missed the true value in 8.8% of the simulations. The 99% intervals were similarly not wide enough so missed the true value in 4.8% of the simulations. Thus the confidence intervals computed to be 99% intervals, actually turned out to be 95% intervals.
These simulations show the advantage of choosing the equation that fits Khalf, rather than the one that fits Kprime. Khalf has a symmetrical distribution so the confidence intervals computed from these fits can be interpreted at face value. In contrast, Kprime has an asymmetrical distribution and its confidence intervals cannot be interpreted at face value.
Coverage of the asymmetrical likelihood confidence intervals
A new feature in Prism 7 is that it can compute asymmetrical likelihood confidence intervals. These intervals will have the same coverage no matter how the equation is parameterized. The 95% CI of Khalf failed to include the true value (25) in only 5.3% of 10,000 simulations. When the equation was parameterized to fit Kprime, the 95% CI failed to include the true value (1.9037) in 5.1% of 10,000 simulations.
This demonstrates the advantage of using asymmetrical confidence intervals. You'll get meaningful confidence intervals no matter how you parameterize the equation. You can choose the parameterization that fits parameters that match the way you think about the system or are easy to explain. You don't need to choose a parameterization that leads to a symmetrical distribution of parameters.
Hougaard's skewness
The results above were obtained by running numerous simulations. There is an easier way to figure out how symmetrical a parameter is. Hougaards skewness quantifies the asymmetry of each parameter, computed from the equation, the number of data points, the spacing of the X values, and the values of the parameters.
For the simulated data set, Hougaard's skewness is 0.09 for Khalf and 1.83 for Kprime. A rule of thumb is to expect problems from asymmetry when the absolute value of the Hougaard's skewness is greater than 0.25, and big problems when the value is greater than 1.0. So Hougaard's skewness tells you that the confidence intervals will be accurate when you fit Khalf, but not be so accurate when you fit Kprime.
Note that Hougaard's skewness can be reported as part of the results of nonlinear regression (choose in the Diagnostics tab). No simulations are required.
Bottom line
Models can often be parameterized in multiple ways. You'll get the same curve either way, but choosing an optimum parameterization ensures that the confidence intervals for the parameters are believable. The best way to assess various parameterizations is to ask Prism to report the value of Hougaards measure of skewness for every parameter. Simulations take a bit more work, but let you see how symmetrical a parameter is.