How the ROUT method of removing outliers works
Prism offers a unique approach to identifying and removing outliers, detailed in reference 1.Because this method combines Robust regression and Outlier removal, we call it the ROUT method.
The ROUT method of regression follows these steps.
1.Our robust nonlinear regression method is used to fit a curve that is not influenced by outliers.
2.The residuals of the robust fit are analyzed to identify any outliers. This step uses a new outlier test adapted from the False Discovery Rate approach of testing for multiple comparisons.
3.Remove the outliers, and perform ordinary least-squares regression on the remaining data.
How to use the ROUT method with Prism
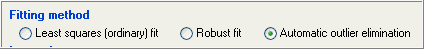
Although the ROUT method requires three steps (listed above), Prism does all this automatically. All you have to do is check an option on the Fit tab of nonlinear regression dialog:
Prism then identifies the outliers, eliminates them, and fits the remaining points. The outliers are shown in a separate table, and the number of outliers is tabulated on the main results table.
The ROUT coefficient Q
The value of Q determines how aggressively the ROUT method defines outliers. The mathematical details are explained in reference 1. This value is set in the Method tab of the Nonlinear regression dialog.
If you set Q to a higher value, the threshold for defining outliers is less strict. This means that Prism will have more power to detect outliers, but also will falsely detect 'outliers' more often.
If you set Q to a lower value, the threshold for defining outliers is stricter. This means that Prism will have a less power to detect real outliers, but also have a smaller chance of falsely defining a point to be an outlier.
Unless you have a strong reason to choose otherwise, we recommend sticking with the default value of 1%. Our simulations have shown that if all the scatter is Gaussian, Prism will falsely find one or more outliers in about 2-3% of experiments. This does not mean that a few percent of all values are declared to be outliers, but rather that one or more outliers will be detected in a few percent of experiments. If there really are outliers present in the data, Prism will detect them with a False Discovery Rate less than 1%.
Unequal weighting, robust regression and outlier removal
As we explain in reference 1, unequal weighting is not useful with robust regression. The problem is that outliers can get way too much weight. Robust regression, essentially, applies differential weights so it doesn't make sense to also add another weigting scheme.
If you choose both unequal weighting and robust fitting, therefore, Prism does the fitting assuming equal weights. However it does use your weighting choice when creating a table of residuals.
If you choose both unequal weighting and automatic outlier removal, Prism first fits using robust regression (ignoring your weighting choice). It does use the weighting factors when identifying the outliers, as explained in reference 1. It then performs weighted nonlinear regression on the outlier-depleted data.
Reference
1.Motulsky HM and Brown RE, Detecting outliers when fitting data with nonlinear regression – a new method based on robust nonlinear regression and the false discovery rate, BMC Bioinformatics 2006, 7:123.