Why initial values?
Before it can perform nonlinear regression, Prism must have initial (estimated) values for each parameter in the equation. It then iteratively modifies these values to improve the fit of the model to the data. The initial values must be reasonable, so that the curve defined by those initial values has generally the shape of the data, and doesn't go awfully far from the data points. If the initial values are really bad, Prism may not be able to fit the model.
The need for initial values is not unique to Prism, but is intrinsic to nonlinear regression.
Why rules for initial values?
Prism can store rules (algorithms) to calculate initial values from the range of your data. If you choose a built-in equation, the rules are taken care of. If you enter your own (user-defined) equation, you can also enter rules to define the initial values of each parameter. If you enter a good set of rules, then your equation will work in the future with no need to think about initial values.
If you don't enter rules for initial values, you will need to enter the initial values for every variable, for every data set, every time you fit data.
If you enter a poor set of rules, then the initial values will not generate a curve that goes near the data points, and it is likely that Prism will not be able to fit the model to the data.
How to enter a rule
While entering or editing a user-defined equation, click on the tab labeled "Rules for initial values". For each parameter, enter a number in the first column and select a value to multiply or divide by.
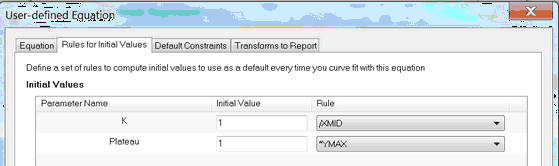
Most often, you'll use the choices based on YMIN, YMID or YMAX, the minimum, middle (mean of minimum and maximum), and maximum Y value in your data set, or the corresponding XMIN, XMID or XMAX.
You can also ask Prism to interpolate, for example to base the initial value on the interpolated value of X at the value of Y half way between the smallest and largest value (XatYmid) and related values.
Initial value, to be fit
The first choice on the drop-down list is "(Initial value, to be fit)". This means that the value you entered in the box to the left will be the initial value for all data sets. The initial value will not depend on the range of the data (it will not be calculated); it will be the actual value you entered.
Initial value based on the range of the data
Most of the rules are based on the range of the X and Y values.
The abbreviation YMIN is the minimum value of Y; YMAX is the maximum value, and YMID is the average of YMIN and YMAX. For example, if you enter "0.5" in the first column and select "YMAX" in the second column, Prism sets the initial value to half of YMAX (which differs for each data set).
The phrase "X at YMID" refers to the X value that corresponds to the mean of the highest and lowest Y values. Calculation details.
SIGN(YatXmax - YatXmin)
It equals +1 if the curve generally goes up as it goes from left to right: /
It equals -1 if the curve generally goes down as it goes from left to right: \
It is used as the initial value for the Hill Slope in dose response curves.
Here is an explanation of the math. The SIGN() function equals +1 when given a positive number, and -1 when given a negative number. YatXMax is the Y value at the largest X values. YatXmin is the Y value at the smallest X value. (YatXmax - YatXmin) will be positive when the curve goes up, and negative when the curve goes down.
Mean of column title values (or the log of that mean)
With some kinds of data, it makes sense to label the data sets numerically. Each column titles has a value.
With these kinds of data, you can access the column title values in two ways:
•Use the Constrain tab and choose "Data set constant (=column title)". That parameter in the model is now a constant, but the value of that constant will differ for each data set column, and gets it value from the column title.
•On the Rules for initial values tab in the dialog that defines an equation, set the initial value of a parameter to equal the mean of those column titles. Or to the logarithm of that mean.
The best way to understand this is with an example. Bring up the sample XY data for competitive enzyme inhibition, and follow the instructions, and inspect the dialog settings.
Initial, middle and final slope
New to Prism 7: Base the initial value on the initial, middle, or final slope (dY/dX at the smallest, middle or largest value of X) or its reciprocal.
Example
Y = Vmax*X/(Km + X)
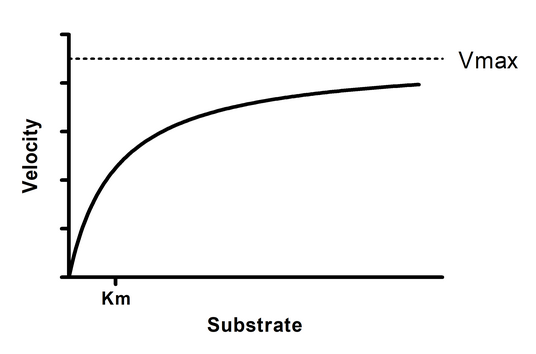
The equation above is the Michaelis-Menten enzyme kinetics model built in to Prism. If you pick this equation as a built-in equation, the rules for initial values are provided automatically. But if you were entering this as a new user-defined equation, it would be easy to come up with rules.
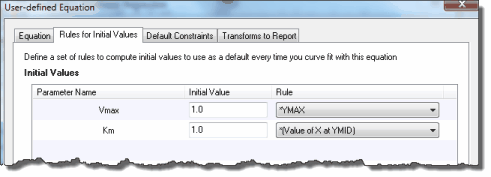
Vmax is the Y value (enzyme velocity) at very high values of X (substrate). So a reasonable initial value would be to set Vmax equal to the largest Y value in the data set. To do this, enter the value 1.0 and choose the multiplier *Ymax. This means Prism will compute the initial value by multiplying the largest Y value by 1.0. You could argue that Vmax is usually higher than the largest Y value, so should compute the initial value by multiplying 1.25 times Ymax. There are often multiple rules one could justify. These rules only compute the initial value, so there is a lot of room for variation.
Km is the X value (substrate concentration) corresponding to a Y value (enzyme velocity) that is half Vmax. Compute its initial value by multiplying 1.0 times "Value of X at Ymid". Prism then averages the largest and smallest Y values to compute Ymid, and then interpolates from straight connecting lines to find the corresponding X value.
Slope at XMIN, XMID or XMAX
These are the slopes (change in Y divided by change of X) at the left, middle or right of the graph. If you have 30 or more data points, Prism computes the slope from the first, middle or last 10% of the points. If you have fewer than 30 points, Prism computes the slope from the first, middle, or last two points.
If you have more than 30 points, the slope is determined by linear regression on the first, middle or last 10% of the points, rounded down. If there are fewer than 30 points, the slope is determined by the first or last two points. For slopeAtYmid with fewer than 30 points, Prism uses two middle points if there are an even number of points, and otherwise uses the three middle points.
What happens if you don't enter any rules?
If you don't enter rules for every parameter, Prism will insist that you enter initial values each time you fit data to the equation.
How to override the initial values defined by rule
The rules are stored with each equation, and the rules can be edited as part of the dialog that defines and edits equations.
The values defined by the rules are shown in the Initial Value tab of the nonlinear regression dialog. To override the initial values:
1.Select one or several data sets on top of the dialog. Or click "Select all" to select all data sets.
2.Uncheck the "Choose automatically" option.
3.Enter the initial value (as a value, a number, not a rule) .
To check how good the initial values are, go to the Diagnostics tab and check the option:
(*)Don't fit the curve. Instead plot the curve defined by the initial values of the parameters.
If the resulting curve doesn't go near the data, revise the initial values (or the rules that generate those values) before asking Prism to fit the model to the data.