Introduction
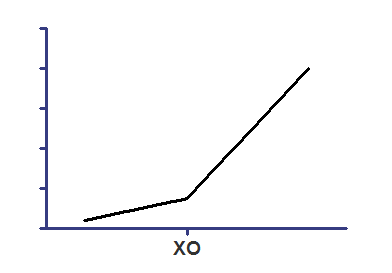
Segmental regression is also commonly referred to as "piecewise" regression or segmented regression. With this method, one line is fit to all data points with an X value less than some specified value X0, while a different line is fit to all data points with an X value greater than X0, while ensuring that the two lines intersect at X0.
A common example of when segmental linear regression is helpful is when X is time, and you did something at time=X0 to change the slope of the line. Perhaps you injected a drug, or rapidly changed the temperature. In these cases, your model really does have two slopes with a sharp transition point.
In other cases, the true model has the slope gradually changing. The data fit a curve, not two straight lines. In this situation, fitting the data with segmental linear regression is not helpful.
Caution
Don't use segmental linear regression to analyze a biphasic Scatchard or Lineweaver-Burk plot. A biphasic Scatchard plot follows a curve, not two intersecting lines. There is no abrupt break point. You should fit the original data to a two-site binding curve instead.
Step by step
Create an XY data table. Enter time into X, and your measurements into Y. If you have several experimental conditions, place the first into column A, the second into column B, etc.
After entering data, click Analyze, choose nonlinear regression, choose the panel equations for lines, and choose Segmental linear regression.
Model
Y1 = intercept1 + slope1*X
YatX0 = slope1*X0 + intercept1
Y2 = YatX0 + slope2*(X – X0)
Y = IF(X<X0, Y1, Y2)
The first line of the equation defines the first line segment from its intercept and slope.
The second line of the equation computes the Y value of the first regression at the right end of that segment, when X=X0.
The third line of the equation computes the second regression segment. Since we want a continuous line, the Y value at the left end of the second segment must equal the Y value at the right end of the first segment (YatX0). The Y value at any other position along the second segment equals YatX0 plus the increase due to the second regression line. That increase equals the slope of the second segment (slope2) times the distance from X0 to X.
The final line defines Y for all values of X. If X is less than X0 then Y is set equal to Y1. Otherwise Y is set equal to Y2.
Interpret the parameters
Intercept1 is the Y value where the first line segment intersects the Y axis.
Slope1 is the slope of the first line segment, expressed in Y units divided by X units.
Slope2 is the slope of the second line segment, expressed in Y units divided by X units.
X0 is the X value where the two line segments intersect. Often you will want to constrain this to a constant value equal to the time you applied an experimental intervention.
Extending to three segments
Prism does not include an equation for segmental regression with three segments, but you could enter this equation as an user-defined equation:
Y1 = intercept1 + slope1*X
YatX0 = intercept1 + slope1*X0
Y2 = YatX0 + slope2*(X - X0)
YatX1 = YatX0 + slope2*(X1-X0)
Y3 = YatX1 + slope3*(X - X1)
Y = IF(X<X0, Y1, IF(X<X1, Y2, Y3))
.