What is linear regression?
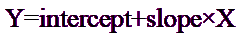
Linear regression fits this model to your data:
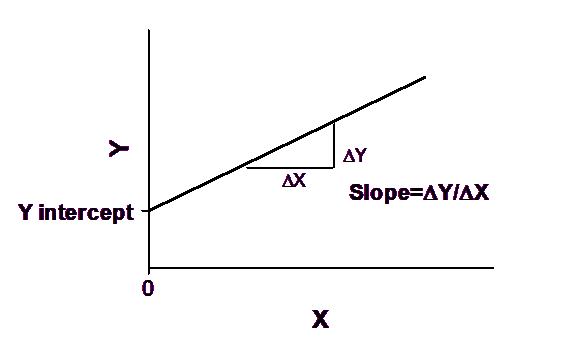
The slope quantifies the steepness of the line. It equals the change in Y for each unit change in X. It is expressed in the units of the Y axis divided by the units of the X axis. If the slope is positive, Y increases as X increases. If the slope is negative, Y decreases as X increases.
The Y intercept is the Y value of the line when X equals zero. It defines the elevation of the line.
Correlation and linear regression are not the same. Review the differences.
Simple vs. multiple linear regression
Simple linear regression is shown above. There is only a single X variable. In contrast, multiple linear regression defines Y as a function that includes several X variables. More generally, there are other types of relationships in which multiple X variables can be used to describe a single Y variable. These methods are collectively referred to as multiple regression (multiple linear regression is a type of multiple regression), and you can read more about the principles of multiple regression here.
Linear vs. logistic regression
In simple linear regression, the dependent (Y) variable is continuous, meaning it can take on any range of values. In some cases, your Y variable may not be continuous. For example, if your Y variable can only be one of two values (for example, yes or no, heads or tails, male or female mice, etc.), then it’s said to be a binary categorical variable. In this case, linear regression is not appropriate. Instead, you might consider using logistic regression, which models the probability of observing a given outcome (sometimes called a “success”). Like linear regression, you can have one or multiple X variables with logistic regression. Read more about simple logistic regression (with only one X variable) and multiple logistic regression (with multiple X variables) for more information.