The terms logistic has three meanings which have little relationship to each other (1).
Meaning 1: Logistic population growth
The term "logistic" was first invented in the nineteenth century to describe population growth curves. The idea is pretty simple. Population growth is limited, so can't ever exceed some value we'll call Nmax. The rate of change of population at any time t is proportional to the number of individuals alive at that time (Nt). But population growth slows down as it reaches the maximum, so is also proportional to (Nmax - Nt). So the rate of change of population is proportional to Nt(Nmax - Nt).
Integrate that differential equation, and the result is called a logistic equation. It defines a sigmoidal shaped curve that defines the population at any time. The model has three parameters: the starting population, the maximum population, and the time it takes to reach half-maximal. Sometimes it is modified to add a fourth parameter to define the steepness of the curve.
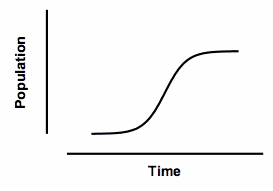
This curve was used by demographers in the past, but actually doesn't do a very good job of describing the growth of human populations. It is still used to model the growth of tumors, and to model the fraction of a population that uses a new product (like a mobile phone).
This model is also used for autocatalytic reactions, where the product of the reaction is also a catalyst for that reaction. With this kind of reaction, the rate of product accumulation is proportional to the concentration of product already produced times the concentration of remaining substrate. This has the same mathematical form as the population growth model. The graph is identical to the one above, except the Y-axis would be the concentration of the product produced by the enzyme reaction (instead of population).
Meaning 2: "Logistic" dose-response curves
Bindslev reviews the history of the many equations used to describe dose response curves(2). A common equation, based on work by Hill, defines a response as a function of the minimum response, the maximum response, the concentration required to evoke a response half-way between the minimum and maximum (the EC50), and a parameter that describes how steep the curve is. In Prism, this equation is called the log(agonist) vs response curve -- Variable slope (four parameters).
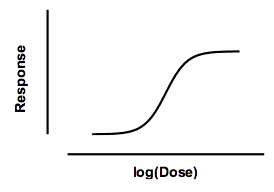
Response at any dose is defined by an equation with four parameters: minimum response, maximum response, the log(EC50), and the slope factor (also called the Hill slope). Surprisingly, this equation has the same mathematical form as the logistic equation describing population growth, even though the two uses are entirely different. For this reason, the dose-response equation is sometimes called a "logistic" equation. Since there are four parameters, it is sometimes called the four parameter logistic equation, abbreviated 4PL.
This dose-response model describes many systems, but it is purely empirical. It does not correspond to any molecular model (except, perhaps, when the Hill slope is an integer).
Note the huge differences between the use of a logistic equation to describe population growth, and its use to describe dose-response curves.
•The X axis of the population growth curve curve is time. The X axis of the dose-response curve is the logarithm of dose or concentration.
•The equation for population growth comes from theory. The equation for dose-response relationships is empirical.
•Despite its name, no logarithms are used in the logistic equation for population growth. The X axis of the logistic dose-response curve is the logarithm of dose or concentration.
Meaning 3: Logistic regression
The third use of the word logistic, completely unrelated to the other two uses, is logistic regression. This is a multiple regression method used when the outcome (dependent variable) has two possible outcomes. When the model only has one predictor variable, it's called "Simple logistic regression", while models that contain multiple predictor variables are referred to as "Multiple logistic regression". The point of the equation is to predict the probability, P, of an outcome from a set of independent variables. To create a model that always predicts a value for P that is between 0 and 1 the logistic regression model actually predicts the natural logarithm of the odds. The function that computes the natural logarithm of the odds from a fraction is called the logit function (pronounced with a long O and a soft G), so regression used to predict the logit of a probability from multiple independent variables is called logistic regression.
References
1. J.S. Cramer. The origins and development of the logit model. Chapter 9 of Logit models from economics and other fields, Cambridge University Press, 2003
2. N. Bindslev, Hill in Hell (pdf), Chapter 10 of Drug-Acceptor Interactions, ISBN: 978-91-977071-0-7