Some programs report a chi-square value with the results of nonlinear regression. Prism doesn't. This page explains how the chi-square value could be useful and why we don't report it.
Is the sum-of-squares too high?
Nonlinear regression minimizes the sum of the squared vertical distances between the data point and the curve. But how can you interpret the sum-of-squares, abbreviated SS? You can't really, as it depends on the number of data points you collected and the units you used to express Y.
The chi-square approach is to compare the observed scatter of the points around the curve (SS) with the amount of experimental scatter you expect to see based theory. This is done by computing chi-square using this equation:
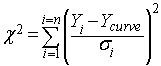
Chi-square is the sum of the square of the ratio of the distance of a point from the curve divided by the predicted standard deviation at that value of X. Note that the denominator is the predicted standard deviation, not the actual standard deviation computed in this particular experiment.
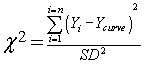
If you know that the SD is the same for all values of X, this simplifies to:
The standard deviation value must be computed from lots of data so the SD is very accurate. Or, better, the SD can come from theory.
If you assume that replicates are scattered according to a Gaussian distribution with the SD you entered, and that you fit the data to the correct model, then the value of chi-square computed from that equation will follow a known chi-square distribution. This distribution depends on the number of degrees of freedom, which equals the number of data points minus the number of parameters. Knowing the value of chi-square and the number of degrees of freedom, a P value can be computed.
How can you interpret a small P value? If you are quite sure the scatter really is Gaussian, and that predicted SD is correct, a small P value tells you that your model is not right -- that the curve really doesn't follow the data very well. You should seek a better model.
But often a low P value just tells you that you don't predict the SD as well as you thought you would. It is hard to determine the SD values precisely, so hard to interpret the chi-square value. For this reason, Prism doesn't attempt the chi-square computation. We fear it would be more misleading than helpful.
Alternatives
Several approaches have been devised to answer the question of whether the SS is too high:
•The value of sum-of-squares can be used to compute R2. This value is computed by comparing the sum-of-squares (a measure of scatter of points around the curve) with the total variation in Y values (ignoring X, ignoring the model). What values of R2 do you expect? How low a value is too low? You can't really answer that in general, as the answer depends on your experimental system.
•If you have collected replicate Y values at each value of X, you can compare the SS with a value predicted from the scatter among replicates. Prism calls this the replicates test. This is very useful, but only if you have collected replicate Y measurements at each X.
•You can propose alternative models, and compare their fit to the data
Summary
Chi-square compares the actual discrepancies between the data and the curve with the expected discrepancies (assuming you selected the right model) based on the known SD among replicates. If the discrepancy is high, then you have some evidence that you've picked the wrong model. The advantage of the chi-square calculation is that it tests the appropriateness of a single model, without having to propose an alternative model and without having to have replicate values. The disadvantage is that the calculation depends on knowing the SD values with sufficient precision, which is often not the case.
Recommended alternatives are to compare the fits of two models, or use the replicates test.