What is the confidence interval of a mean?
The confidence interval (CI) of a mean tells you how precisely you have determined the mean.
For example, you measure weight in a small sample (N=5), and compute the mean. That mean is very unlikely to equal the population mean. The size of the likely discrepancy depends on the size and variability of the sample.
If your sample is small and variable, the sample mean is likely to be quite far from the population mean. If your sample is large and has little scatter, the sample mean will probably be very close to the population mean. Statistical calculations combine sample size and variability (standard deviation) to generate a CI for the population mean. As its name suggests, the CI is a range of values.
What assumptions are made in interpreting a CI of a mean?
To interpret the confidence interval of the mean, you must assume that all the values were independently and randomly sampled from a population whose values are distributed according to a Gaussian distribution. If you accept those assumptions, there is a 95% chance that the 95% CI contains the true population mean. In other words, if you generate many 95% CIs from many samples, you can expect the 95% CI to include the true population mean in 95% of the cases, and not to include the population mean value in the other 5%.
How is it possible that the CI of a mean does not include the true mean
The upper panel below shows ten sets of data (N=5), randomly drawn from a Gaussian distribution with a mean of 100 and a standard deviation of 35. The lower panel shows the 95% CI of the mean for each sample.
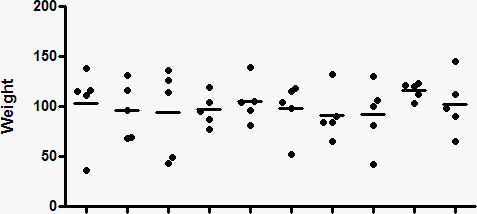
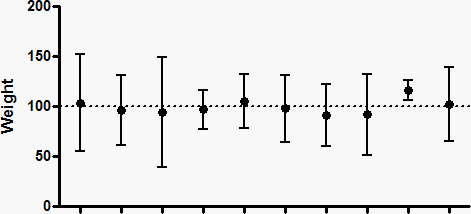
Because these are simulated data, we know the exact value of the true population mean (100), so can ask whether or not each confidence interval includes that true population mean. In the data set second from the right in the graphs above, the 95% confidence interval does not include the true mean of 100 (dotted line).
When analyzing data, you don't know the population mean, so can't know whether a particular confidence interval contains the true population mean or not. All you know is that there is a 95% chance that the confidence interval includes the population mean, and a 5% chance that it does not.
How is the confidence interval of a mean computed?
The confidence interval of a mean is centered on the sample mean, and extends symmetrically in both directions. That distance equals the SE of the mean times a constant from the t distribution. The value of that constant depends only on sample size (N) as shown below.
N |
Multiplier |
2 |
12.706 |
3 |
4.303 |
5 |
2.776 |
10 |
2.262 |
25 |
2.064 |
50 |
2.010 |
100 |
1.984 |
500 |
1.965 |
N |
=TINV(0.05,N-1) |
The samples shown in the graph above had five values. So the lower confidence limit from one of those samples is computed as the mean minus 2.776 times the SEM, and the upper confidence limit is computed as the mean plus 2.776 times the SEM.
The last line in the table above shows you the equation to use to compute the multiplier in Excel. The newer syntax is =T.INV.2T(0.005, N-1).
A common rule-of-thumb is that the 95% confidence interval is computed from the mean plus or minus two SEMs. With large samples, that rule is very accurate. With small samples, the CI of a mean is much wider than suggested by that rule-of-thumb.