What is the SD?
The standard deviation (SD) quantifies variability or scatter, and it is expressed in the same units as your data.
How to interpret the SD when the data are Gaussian
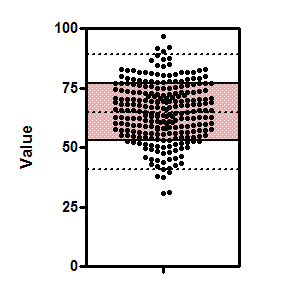
If the data are sampled from a Gaussian distribution, then you expect 68% of the values to lie within one SD of the mean and 95% to lie within two SD of the mean. This figure shows 250 values sampled from a Gaussian distribution. The shaded area covers plus or minus one SD from the mean, and includes about two-thirds of the values. The dotted lines are drawn at the mean plus or minus two standard deviations, and about 95% of the values lie within those limits.

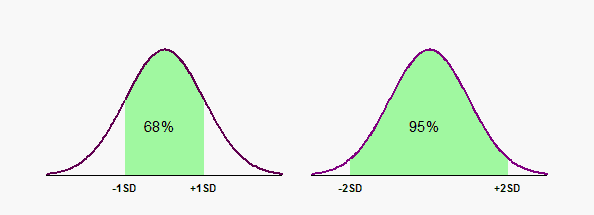
The graph that follows shows the relationship between the standard deviation and a Gaussian distribution. The area under a probability distribution represents the entire population, so the area under a portion of a probability distribution represents a fraction of the population. In the graph on the left, the green (shaded) portion extends from one SD below the mean to one SD above the mean. The green area is about 68% of the total area, so a bit more than two thirds of the values are in the interval mean plus or minus one SD. The graph on the right shows that about 95% of values lie within two standard deviations of the mean.
How to interpret the SD when the data are not Gaussian
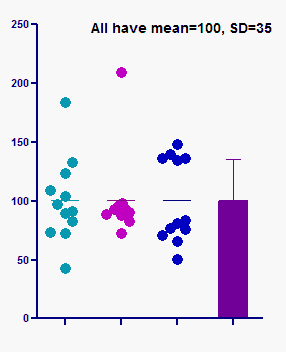
The figure below shows three sets of data, all with exactly the same mean and SD. The sample on the left is approximately Gaussian. The other two samples are far from Gaussian yet have precisely the same mean (100) and standard deviation (35).

This graph points out that interpreting the mean and SD the usual way can be misleading if you assume the data are Gaussian, but that assumption isn't true.
The SD can still be interpreted without assuming a Gaussian distribution. The Chebyshev theorem states that even if data are not sampled from a Gaussian distribution:
•At least 75% of the values must lie within two standard deviations of the mean
•At least 89% of the values must be within three standard deviations
How to report standard deviations
Many people report a mean and a standard deviation something like this: "115±10 mmHg", with a footnote or statement in the Methods section defining the second value as a standard deviation.
Some (1,2) say that because the standard deviation is a single value that quantifies scatter, it should not follow a plus/minus symbol but instead should appear like this: "115 mmHg (SD 10)".
1.Curran-Everett D, Benos D. Guidelines for reporting statistics in journals published by the American Physiological Society. AJP - Gastrointestinal and Liver Physiology. 2004 Aug 1;287(2):G307.
2.Ludbrook J. The presentation of statistics in Clinical and Experimental Pharmacology and Physiology. Clin Exp Pharmacol Physiol. 2008 Oct 1;35(10):1271–4; authorreply1274.
