Features and functionality described on this page are available with our new Pro and Enterprise plans. Learn More... |
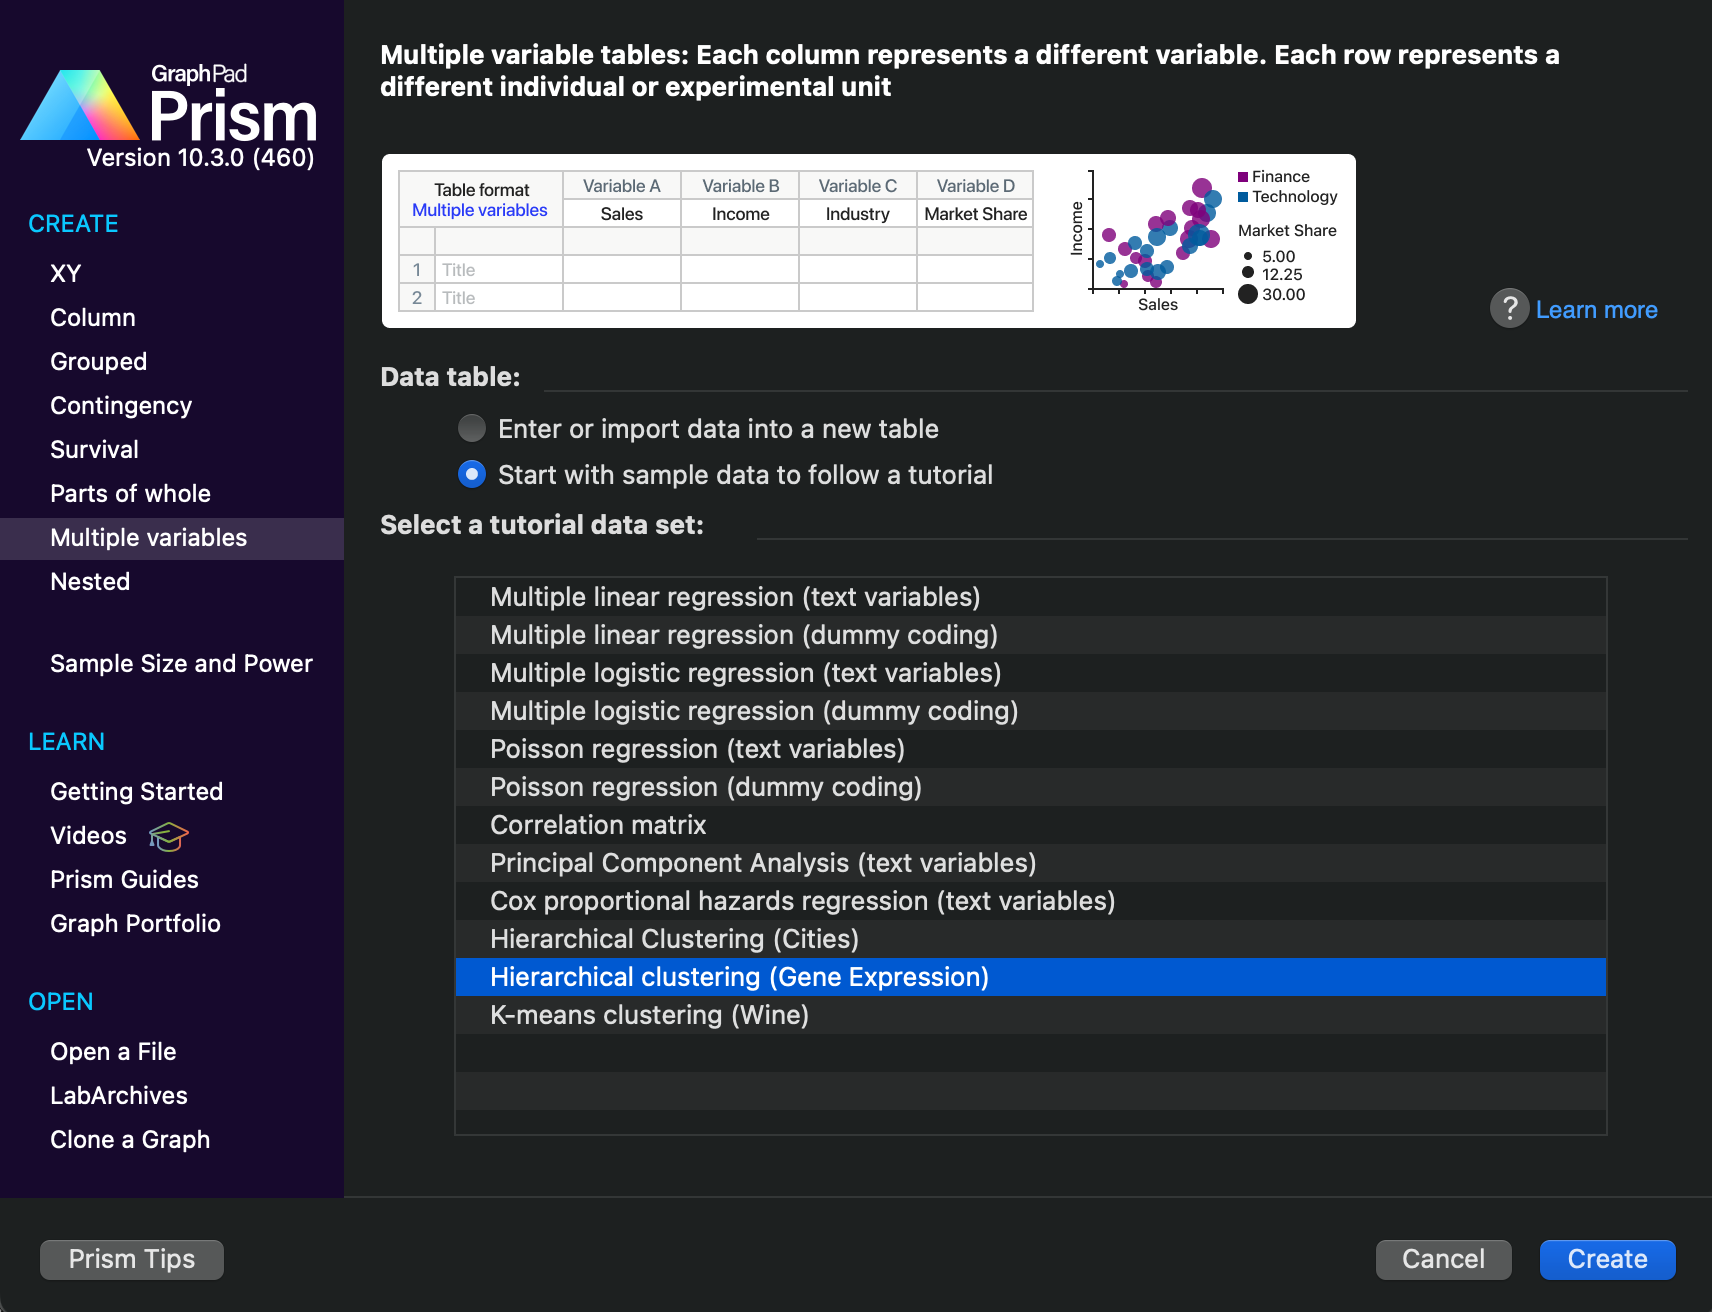
1.From the Welcome or new Table dialog, create a multiple variables data table.
The multiple variables data table is the only type of table that can be used to perform K-means clustering. You may either choose to enter your own data into a new table or to start with the K-means clustering sample data set.
2.Enter the data.
Generally, each column of a multiple variables data table represents a different variable, while each row represents a different observation or experimental replicate (subject, object, individual, etc.). The K-means clustering algorithm can only be applied to cluster the rows of the input data. When clustering rows, the values within each row (and across all relevant columns) are used to define the “location” of that row which is then used to calculate distances.
3.Perform the analysis
From the data table, click the Analyze toolbar button (img). Select K-means clustering either in the Clustering analyses section or in the Multiple variable analyses section of the dialog, then click the OK button. This will invoke the Parameters: K-means Clustering dialog which consists of four tabs:
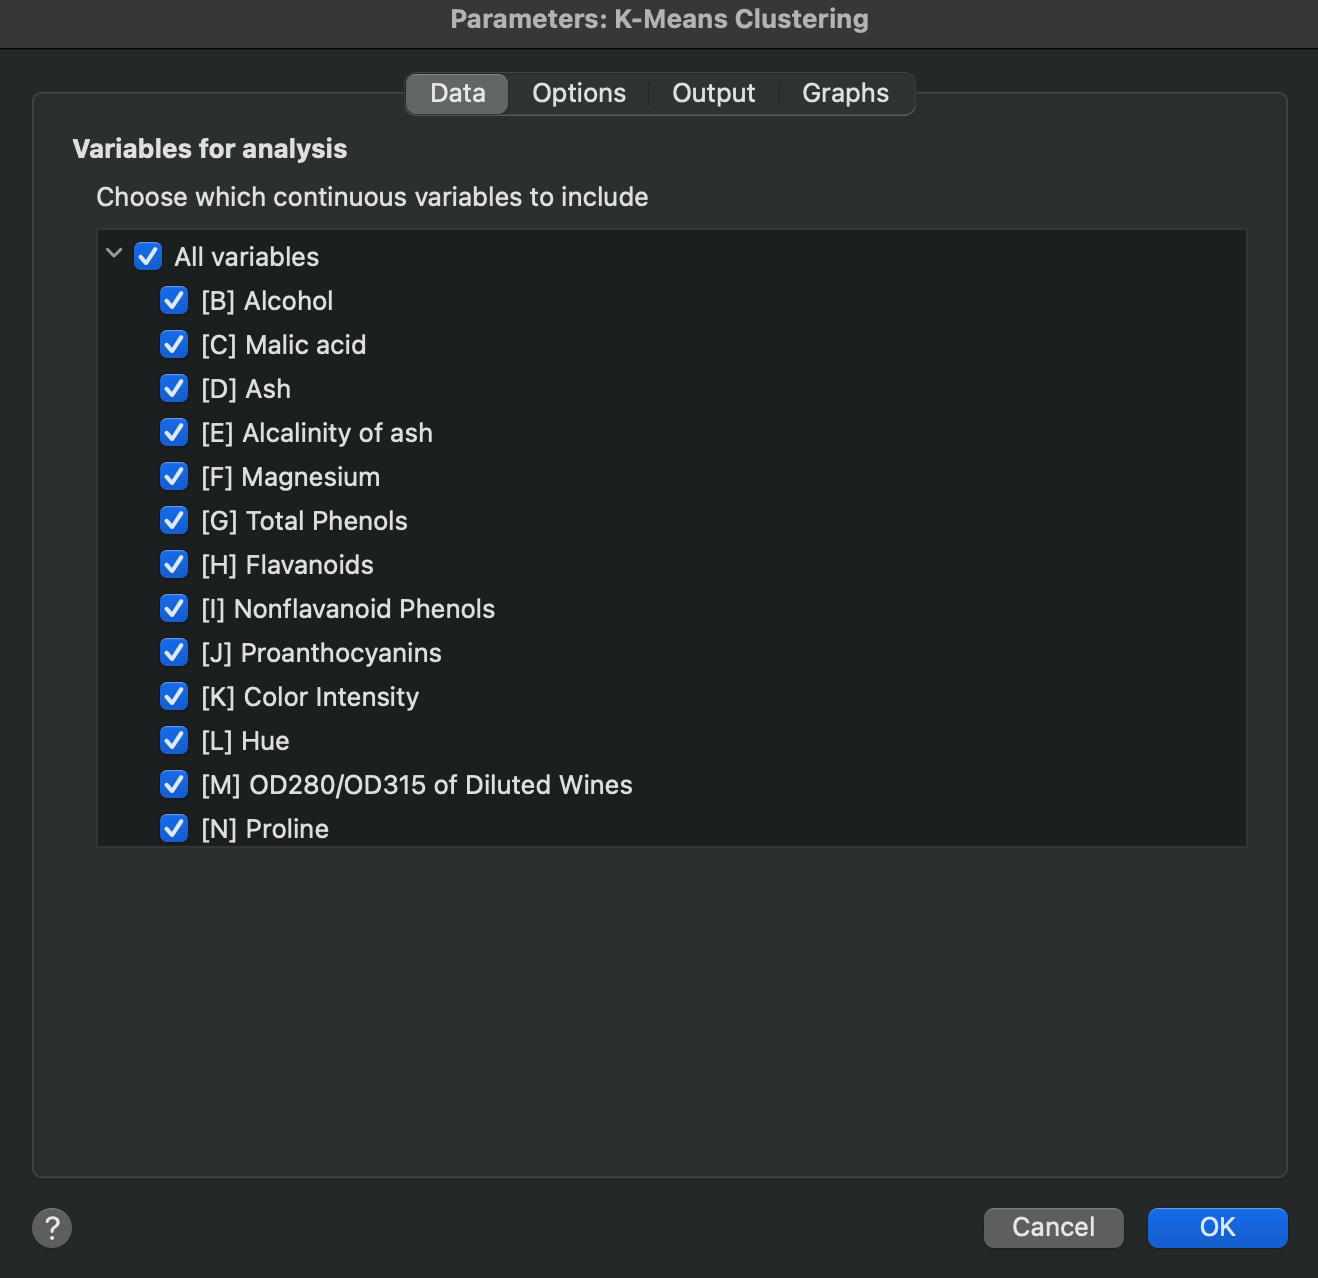
a.Data: Choose the variables (columns) that will be included in the analysis.
b.Options: specify the desired scaling method for columns, choose a distance calculation method, specify a preferred computation algorithm, indicate a range of clusters to try to fit the data into, and (optionally) specify a random seed to use for the analysis
c.Output: Customize the reported output generated by the analysis. Additionally, choose how many significant digits to report in these tables.
d.Graphs: Select which graph(s) Prism should generate as part of this analysis