The objective of Cox proportional hazards regression is to estimate the hazard rate (and subsequently the survival function) for the observed population. The value of the hazard function depends not only on elapsed time to the event of interest, but also on the values for each of the predictor variables included in the model. Using the fit model and known values of each predictor variable in the model, predictions can be made for estimated survival probabilities at given time points. While this is a powerful feature, it is not required to perform Cox regression and can be ignored unless specific predictions from the model are desired.
Predictions with Cox regression
Once a model is fit using Cox proportional hazards regression, it is possible to estimate a specific value for the hazard (and survival probability) at a given time, assuming values for each of these predictor variables are supplied. Prism can predict values for the hazard and survival probability using information supplied in two different locations: from points in the input data table, and using specific points on the Predictions tab.
Predict (or interpolate) from values of predictor variables in the data table
When this box is checked, Prism will examine the input data table for rows that:
1.Contain a value for the elapsed time to the event of interest
2.Contain a value for each predictor variable in the specified model
3.Do not contain a value for the outcome (event/censor) variable
For each of these rows, Prism will use the determined best-fit parameter coefficients along with the values in this row of the data table to calculate the corresponding values of the linear predictor (Xβ), the hazard ratio (exp[Xβ]), and the cumulative survival for these observations. Note that unlike simple linear or nonlinear regression, rows used for interpolation are not required to be at the end of the data table. Prism will search for any row that meets the three criteria above for interpolation.
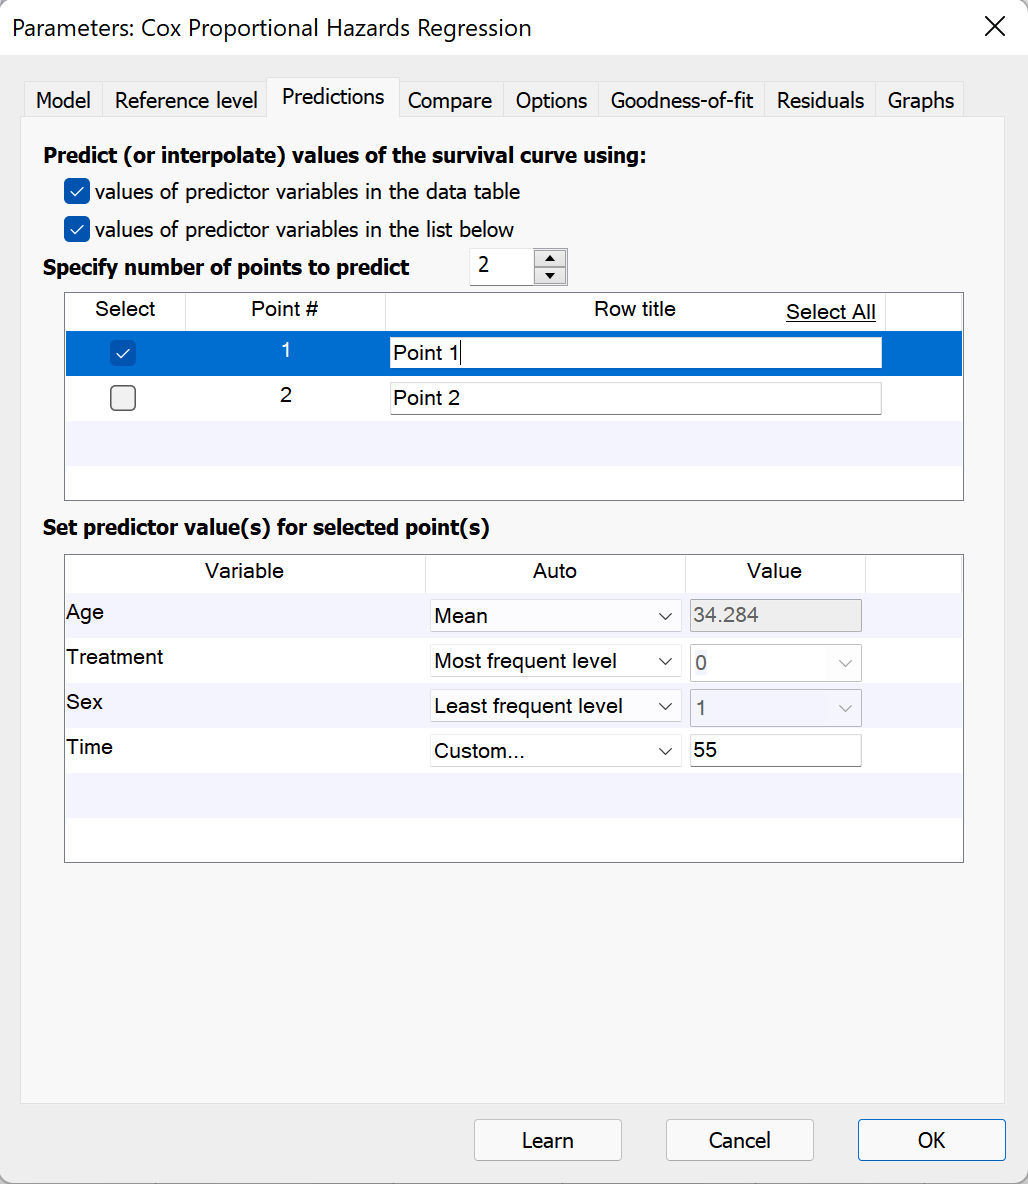
Predict (or interpolate) from values of predictor variables in the dialog
When this box is checked, Prism allows you to create custom points for interpolation (prediction) by specifying values for the elapsed time to the event of interest as well as values for each of the predictor variables in the model. Use the up/down arrows to specify the number of points to be added for interpolation. In the top of the two boxes, a name/label can be added for each interpolated point.
Each point for interpolation must have defined values for each of the predictor variables in the model, and must also include a value for the elapsed time to the event of interest. To specify these values, select an “Auto” method or choose “Custom…” from the dropdown menu. The default settings for each predictor are as follows:
•Continuous variables (including the elapsed time to event of interest variable): the Auto dropdown will be set to “Default” and the value will be zero
•Categorical variables: the Auto dropdown menu and value will match the settings of the Reference level for this variable. If the reference values have not been changed manually, the Auto dropdown menu will be set to “First level (default)”
Because the default value for elapsed time is set to zero, the predicted value for cumulative survival will be 1 (the predicted survival at an elapsed time of zero is assumed to be 1 or 100%).
For each predictor variable, you can enter a value or choose the minimum, maximum, or the value of that variable.
Similarly, for categorical variables, Prism provides options for interpolation using the first level, the last level, or the most/least frequent level in the data. Once again, if the data changes, Prism will automatically update the interpolation accordingly.
Finally, for both continuous and categorical variables, Prism allows for entry of a “Custom…” value to be entered for interpolation.
What happens to the predicted values if the input data changes
When the input data for Cox proportional hazards regression are changed, Prism will automatically recalculate regression coefficients for the specified model. This will have an effect on the values being predicted using the model. Additionally, for points predicted using values of predictor variables listed in the dialog, changes made to the data may change the values of various "Auto" assignment methods.
For continuous variables, Prism provides options to interpolate from the minimum, maximum, or mean value of that variable in the data table (using the "Auto" method dropdown menu). If the data are changed, this minimum, maximum, or mean value may also change, resulting in a different value used during interpolation calculations.
Similarly for categorical variables, Prism provides options to interpolate using the first level, last level, most frequent level, or least frequent level of that variable in the data table (using the "Auto" method dropdown menu). If the data are changed, the first, last, most frequent, or least frequent level may also change, resulting in a different value used during interpolation calculations.
Note that the default "Auto" method (and value) for categorical variables used for interpolation will match the method (and value) of the reference level for that variable. However, once a point is interpolated using a specific method, changing the method for reference level determination will not change the assigned method for the interpolated point.