Every analysis that reports P values lets you choose the decimal format used to report P values. Each analysis that computes P values gives you these choices:
•APA (American Psychological Association) style, which shows three digits but omits the leading zero (.123). P values less than 0.001 shown as "< .001". All P values less than 0.001 are summarized with three asterisks, with no possibility of four asterisks.
•NEJM (New England Journal of Medicine) style, which shows three digits and includes the leading zero (0.123). P values less than 0.001 shown as "< .001". All P values less than 0.001 are summarized with three asterisks, with no possibility of four asterisks.
•GraphPad style which reports four digits after the decimal point with a leading zero (0.1234). P values less than 0.0001 shown as "< .0001". P values less than 0.001 are summarized with three asterisks, and P values less than 0.0001 are summarized with four asterisks.
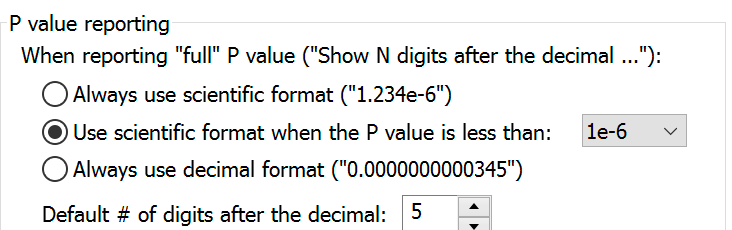
•Choose how many digits you want to see after the decimal point, up to 15. P values less than 0.001 are given three asterisks, and P values less than 0.0001 are given four asterisks. You'll choose this option in each analysis individually. But if you do choose this option, the exact appearance of the P value (decimals or scientific notation) will depend on a setting in the Analysis tab of the Prism preferences dialog. This is where you can also set the default number of digits after the decimal.
See how Prism summarizes P values using asterisks, i.e. ***.