Survival analysis often deals with experimental designs where different subjects are followed for different elapsed times. How can one quantify the median followup time? Survival analysis (in Prism and other programs) tells you the median survival time. But what about the median time of followup?
Note the distinction between the median survival time and the median time that research subjects were followed (the topic of this page).
As part of the results of survival analysis, Prism presents a table that includes the nubmer of subjects at risk over time. One thought is to look at this table and see how long it takes for the number to drop to half of the starting value. But there are two reasons why the number-at-risk drops over time:
1.A subject can experience the event of interest
2.A subject’s observation can be censored
Schemper and Smith (1) came up with a clever way to use the entered survival data to estimate median followup time. The trick is by reversing what is considered to be the event of interest. Consider a study in which the event of interest is actually the loss-of-followup (this description works as this is a one-time event that any subject in the study could experience). With this starting point, it can be seen that if a subject experiences the event of interest, we can’t know how long they would have been followed leading up to their loss-of-followup. To investigate this idea analytically, Schemper and Smith suggest running the Kaplan-Meier analysis again, but with the meaning of the status indicator reversed (use a 1 to indicate loss-of-followup or a censored observation, and a 0 to indicate that the subject experienced the event of interest from the original study). When performing the Kaplan-Meier survival analysis on this reversed data, the meaning of the “median survival time” can actually be interpreted as the median time to “loss-of-followup”. In other words, this is the median followup time!
To do this in Prism:
1.From the survival analysis results of the original data, click New > Duplicate current sheet
2.Click OK on the Analyze Data dialog that appears
3.The “Parameters: Survival Curve” dialog will appear. On this dialog, swap the indicator variables. The default is for 1 to denote the event of interest and 0 to denote censoring. Reverse this convention in the dialog (but leave the data alone). Tell Prism that 0 denotes the event of interest, and 1 denotes censoring
4.Press OK and look at the results page. Ignore the logrank test and its P value. These values cannot be interpreted. Instead, look at the value for “median survival”. Since the indicator variables were swapped, this value really indicates the median followup time
5.The Kaplan-Meier graph created from this analysis tracks the number of patients being followed over time. It is distinct from the Kaplan-Meier graph that tracks survival probability over time
For the sample data comparing two groups, the results (with some polishing) look like this:
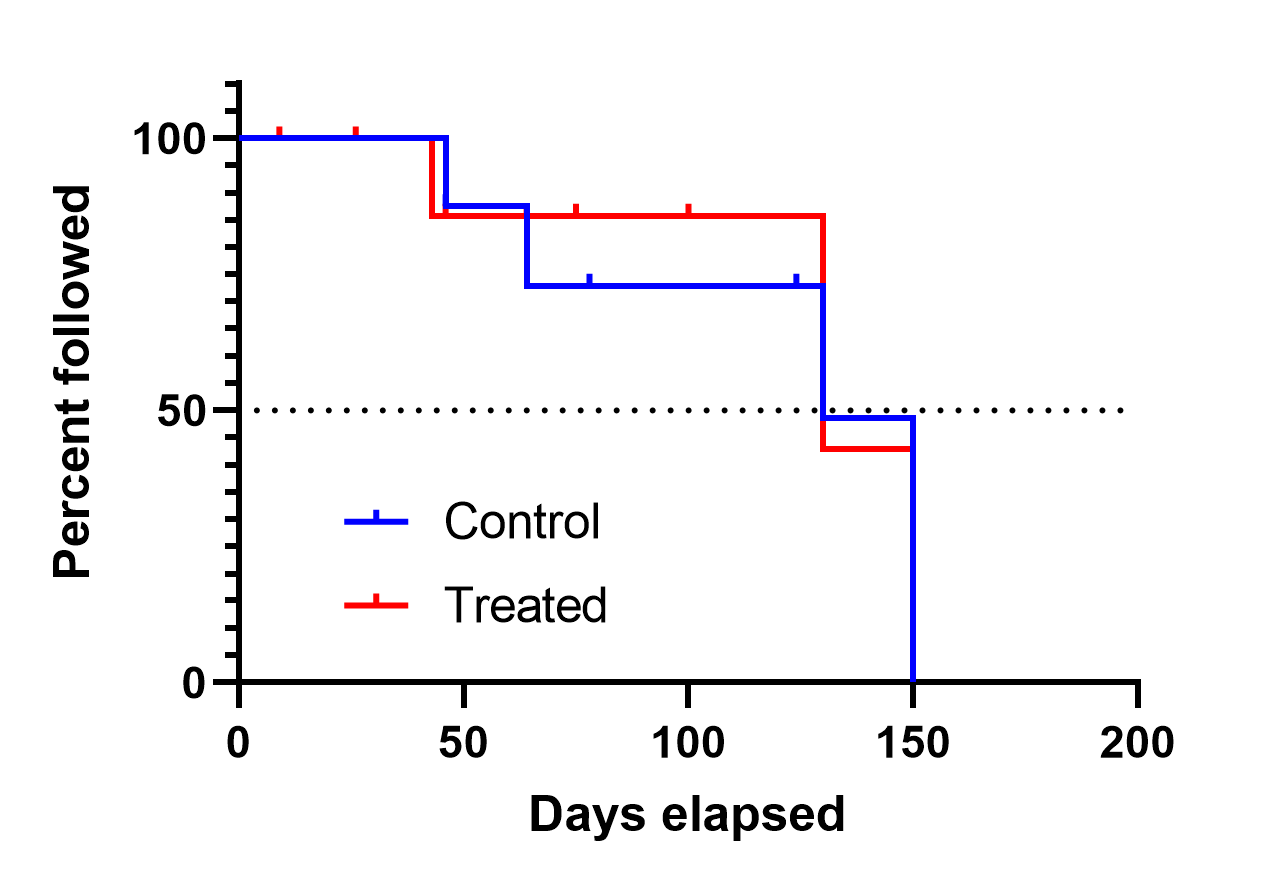
The median followup time for both groups was 130 days. For the sake of comparison, here’s the survival curve for the same data:
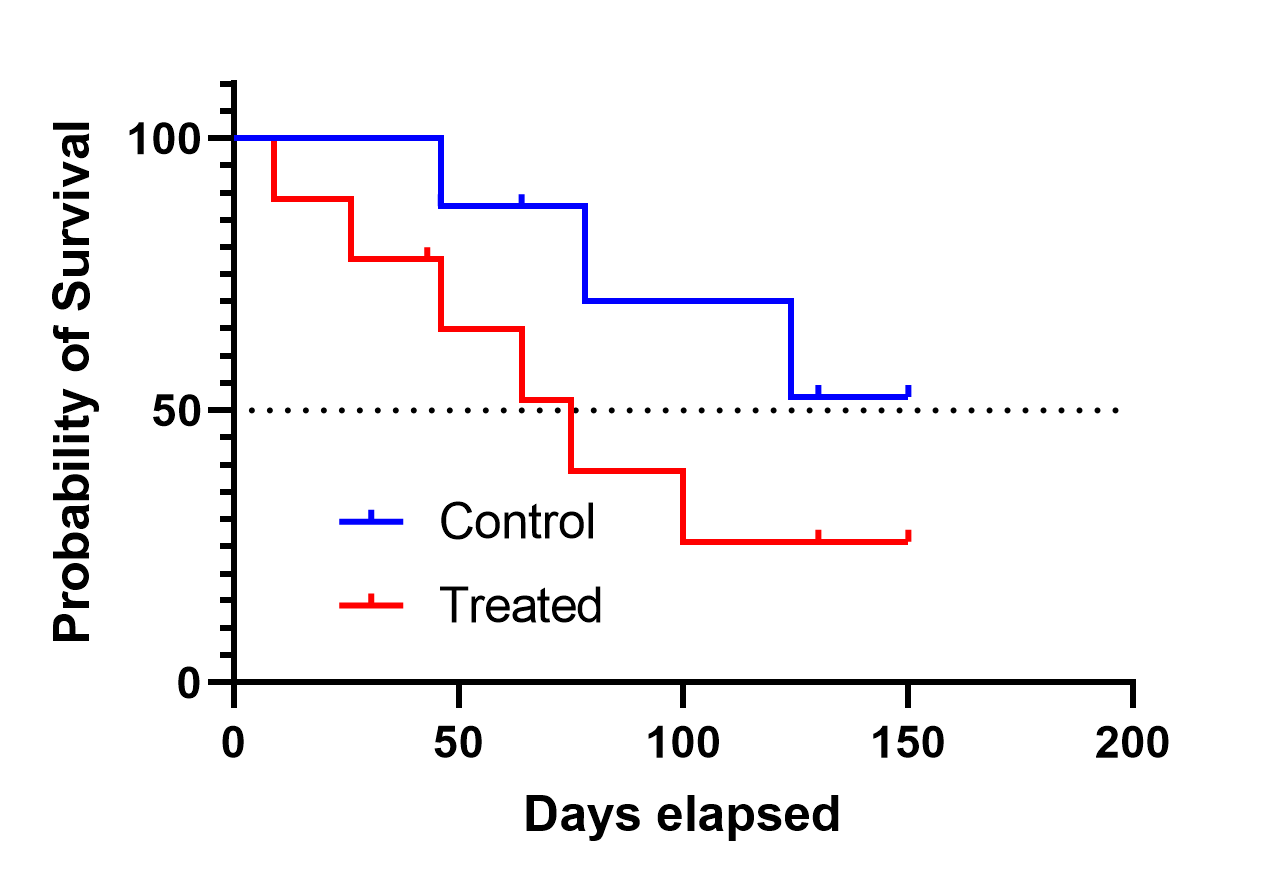
The median survival time for the Treated group occurred at 75 days, while the median survival time for the Control group is undefined (the curve never crosses the 50% survival probability line).
Reference
1.M Schemper and TL Smith. A note on quantifying follow-up in studies of failure time. Controlled clinical trials (1996) vol. 17 (4) pp. 343-346