Random or pseudo-random?
The only way to generate truly random numbers is through a random physical process, such as tossing dice or measuring intervals between radioactive decays. Prism, like all computer programs, generates “random” numbers from defined calculations. Since the sequence of numbers is reproducible, mathematicians say that the numbers are “pseudo-random”.
The difference between truly random and pseudo-random numbers rarely creates a problem. For most purposes, computer-generated random numbers are random enough to simulate data and test analytical methods.
Prism uses the time of day when calculating the first random number, so you will get a different series of random numbers every time you run the program.
Random numbers from a Gaussian distribution
Prism generates random values from a Gaussian distribution using routines adapted from ideas presented in Numerical Recipes in C, (W. H. Press et al, second edition, Cambridge Press, 1992). The function RAN3 (defined in Numerical Recipes) generates uniformly distributed random numbers and the function GASDEV transforms them to a Gaussian distribution with a mean of zero and a standard deviation you enter.
If you choose relative error, Prism first calculates a random number from a Gaussian distribution with a mean of zero and with a SD equal to the percent error you enter. It then multiplies that percentage times the ideal Y value to yield the actual random value that is added to the Y value.
Random numbers from a t distribution
Prism also can generate random numbers from a t distribution with any number of degrees of freedom (df). This lets you simulate wider scatter than Gaussian. If df is low, this distribution is very wide. If df is high (more than 20 or so), it is almost indistinguishable from a Gaussian distribution. If df=1, the distribution is extremely wide (lots of outliers) and is identical to a Lorentzian distribution, also known as the Cauchy distribution. Prism uses this equation to generate random numbers from the t distribution with df degrees of freedom:
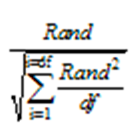
In this equation, Rand is a random number drawn from a Gaussian distribution with mean=0 and SD=1. To compute a random number from a t distribution with df degrees of freedom, Prism generates df+1 different random numbers drawn from a Gaussian distribution.
Random numbers from a Poisson or Binomial distribution
We adapted ideas from pages 372-377 of Numerical Recipes, third edition, by WH Press and colleagues.
Note an important difference between Poisson and binomial random values and Gaussian.
•With Gaussian random values, the simulated value equals the calculated ideal value plus a random error drawn from the Gaussian distribution (with a mean of zero and a SD you specify). We say "plus" the random value, but this random value will be negative half the time (on average), so the simulated value will be less than the idea value half the time.
•With Poisson, the simulated value is a random value drawn from a Poisson distribution, using the ideal value computed in the simulation as the population value of the Poisson distribution. With Gaussian errors, you specify a standard deviation in the simulate dialog. Not so with Poisson error. The simulated Poisson value is always an integer.
•With binomial, the simulated value is a random variable drawn from a binomial distribution with a population proportion (or percentage) computed by the simulation, and using a sample size you entered.
Random numbers with Excel
If you want to do simulations not possible with Prism, it might be possible with Excel. The methods listed below work well with Excel 2003 and later, but should not be used with earlier versions of Excel.
Excel offers two random number functions.
•The RANDBETWEEN(low, high) formula chooses a random integer randomly from the range between (and including) the low and high values entered. The result is always an integer, so this function is not very useful.
•The RAND() function generates a random value between 0.0 and 1.0. It is an Excel function, at least in name, so it needs to be followed by parentheses, but the function has no inputs so there is nothing between the parentheses.
If you want to generate random numbers from a Gaussian distribution, you'll need to transform the values generated with the RAND() function. This Excel formula computes a random number from a Gaussian distribution with a mean of 0.0 and a SD of 1.0.
=NORMSINV(RAND())
The RAND() function calculates a random number from 0 to 1. the NORMSINV() function takes a fraction between 0 and 1 and tells you how many standard deviations you need to go above or below the mean for a cumulative Gaussian distribution to contain that fraction of the entire population.
Multiple by the standard deviation and add a mean, and you'll have random numbers drawn from a Gaussian distribution with that mean and SD. For example, use this formula to sample from a Gaussian distribution with a mean of 100 and a SD of 15:
=(NORMSINV(RAND())*15)+100