The multiple comparisons table
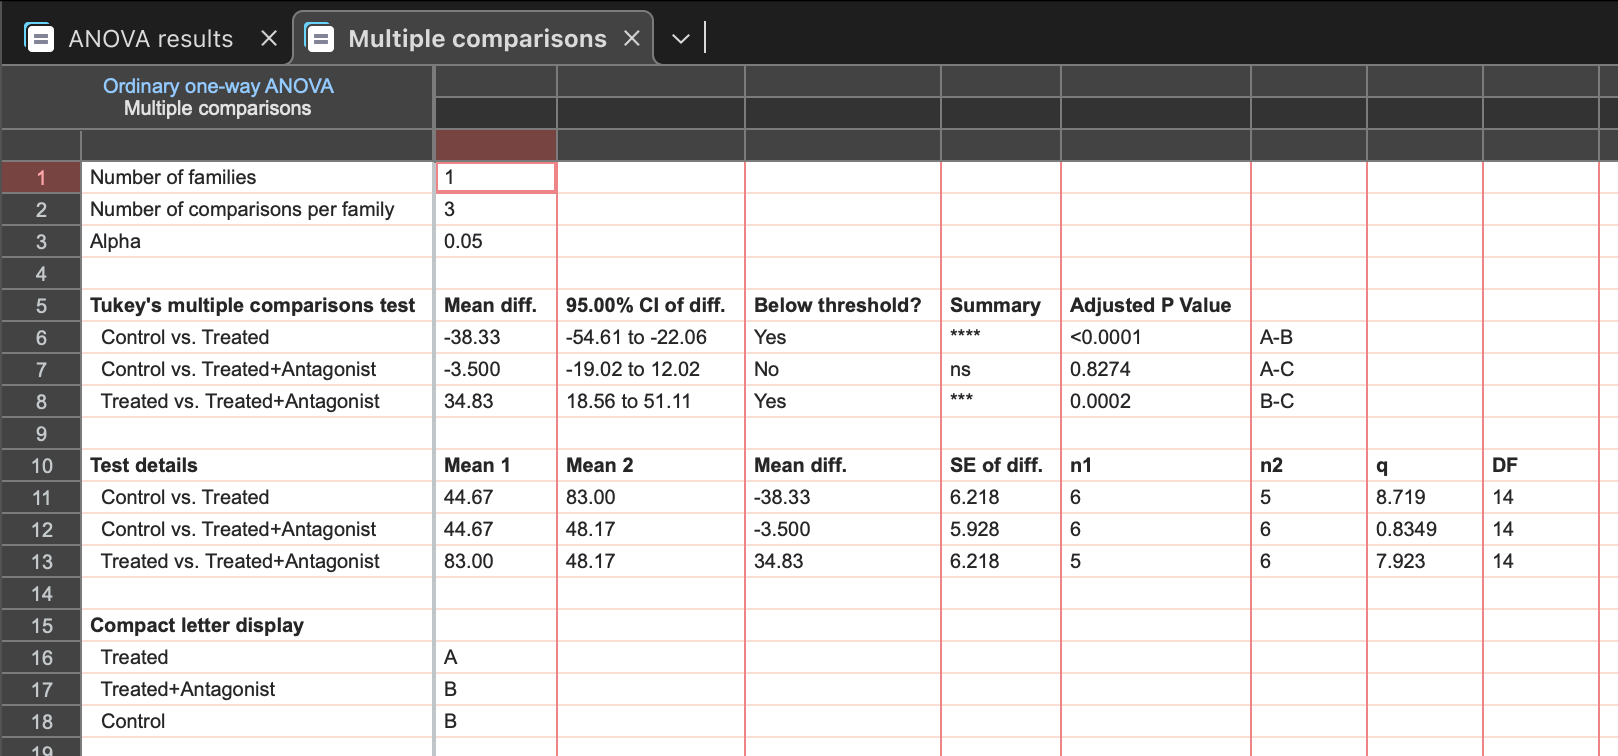
The multiple comparisons results are shown in a table in its own results tab. For each pairwise comparison it shows:
•The difference between the two means (if you chose to assume normal distributions) or the ratio of geometric means (if you chose to assume lognormal distributions)
•The 95% confidence interval of that difference (or ratio),
•The adjusted P value.
•The P value summarized as whether or not it is less than the alpha threshold chosen in the Options tab of the ANOVA parameters dialog (usually 0.05), and as a summary with asterisks.
•The means (or GeoMeans) and sample sizes, etc.
Note that the p-values and confidence intervals are corrected for multiple comparisons (unless you chose the Fisher's LSD test). A 95% confidence interval is meant to give 95% confidence about the entire set of comparisons. An alpha value of 0.05, means that if the null hypothesis was true, there is only a 5% chance that any of the comparisons would result in an adjusted P value greater than 0.05.
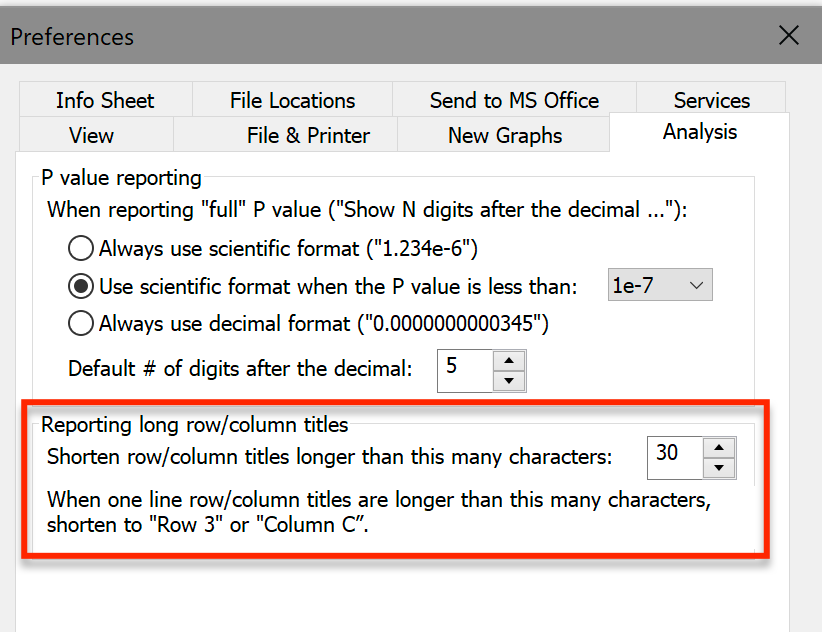
When does Prism display column (or row) titles and when does it use it shorten these titles to letters (or row numbers)?
When the titles are short, Prism will label the multiple comparison results using those titles, for example "Treated - Control". If the titles are split onto two or more lines or are long, Prism will switch to a more compact form, for example "Column B - Column A". How long is long? You set the threshold (for one line titles) on the Analysis tab of the Preferences dialog.
Graphing multiple comparisons results
Prism can display the results of multiple comparisons on a graph in two ways. These are not chosen in the ANOVA parameters dialog, but are instead chosen while working on the graph. Click one of two buttons on the Draw section of the tool bar, or open the Insert menu and choose Pairwise Comparisons or Compact letter display.
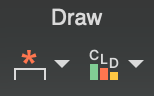
Below is an example of graphs with both options (pairwise comparisons on the left, compact letter display on the right).

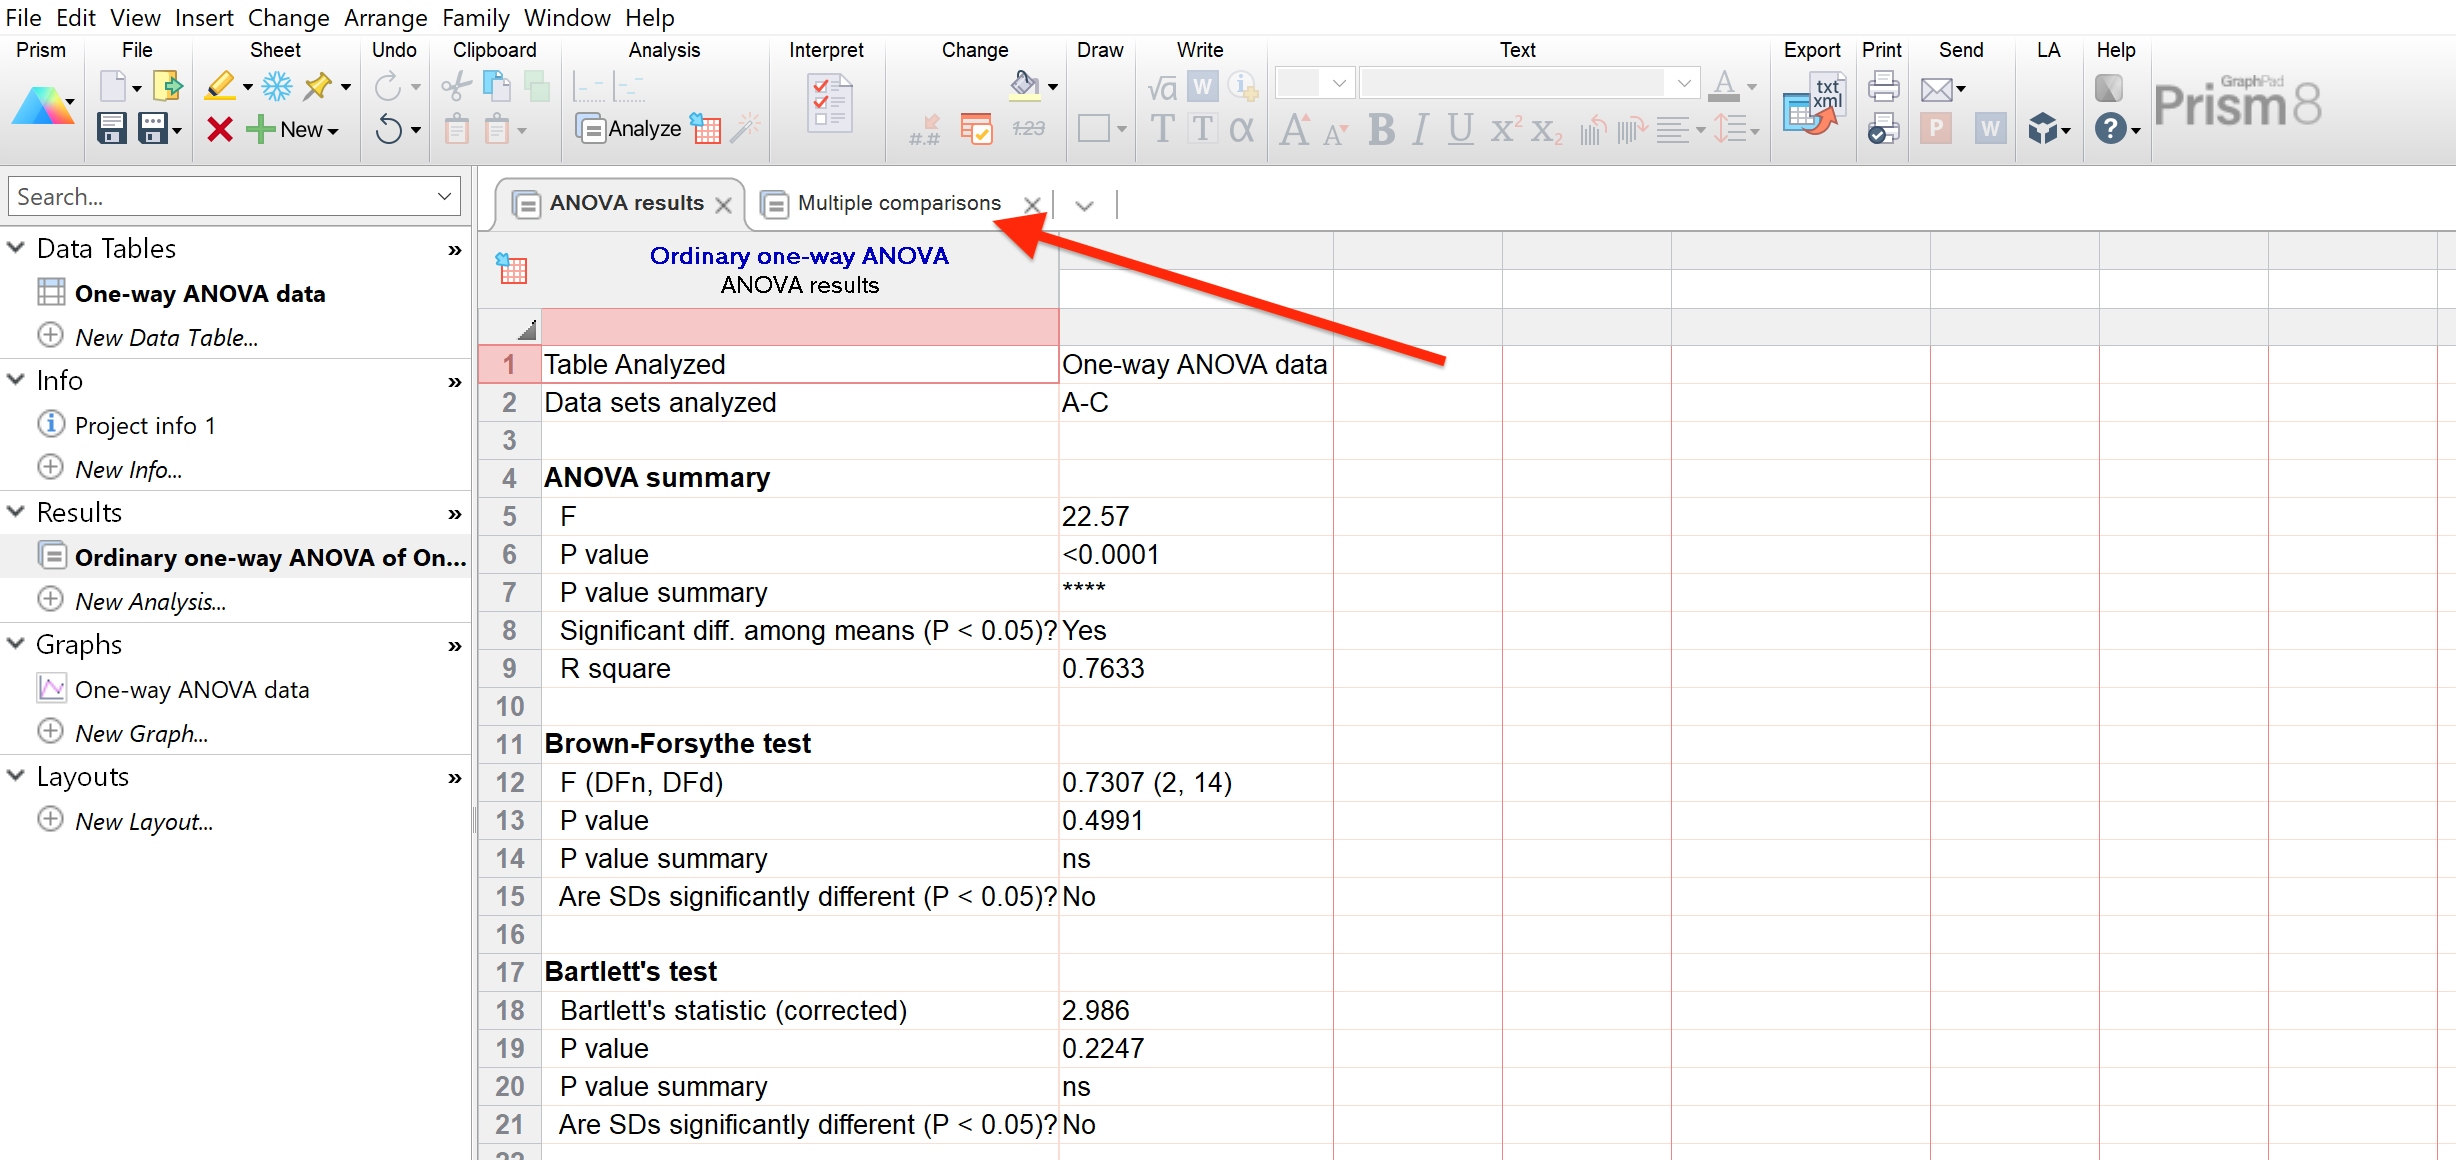
Where are the multiple comparison results?
Starting with version 8, Prism presents some results on multiple tabs. Multiple comparison results are always on a separate results tab than the main ANOVA results. Click on the Multiple Comparisons tab to see those results.
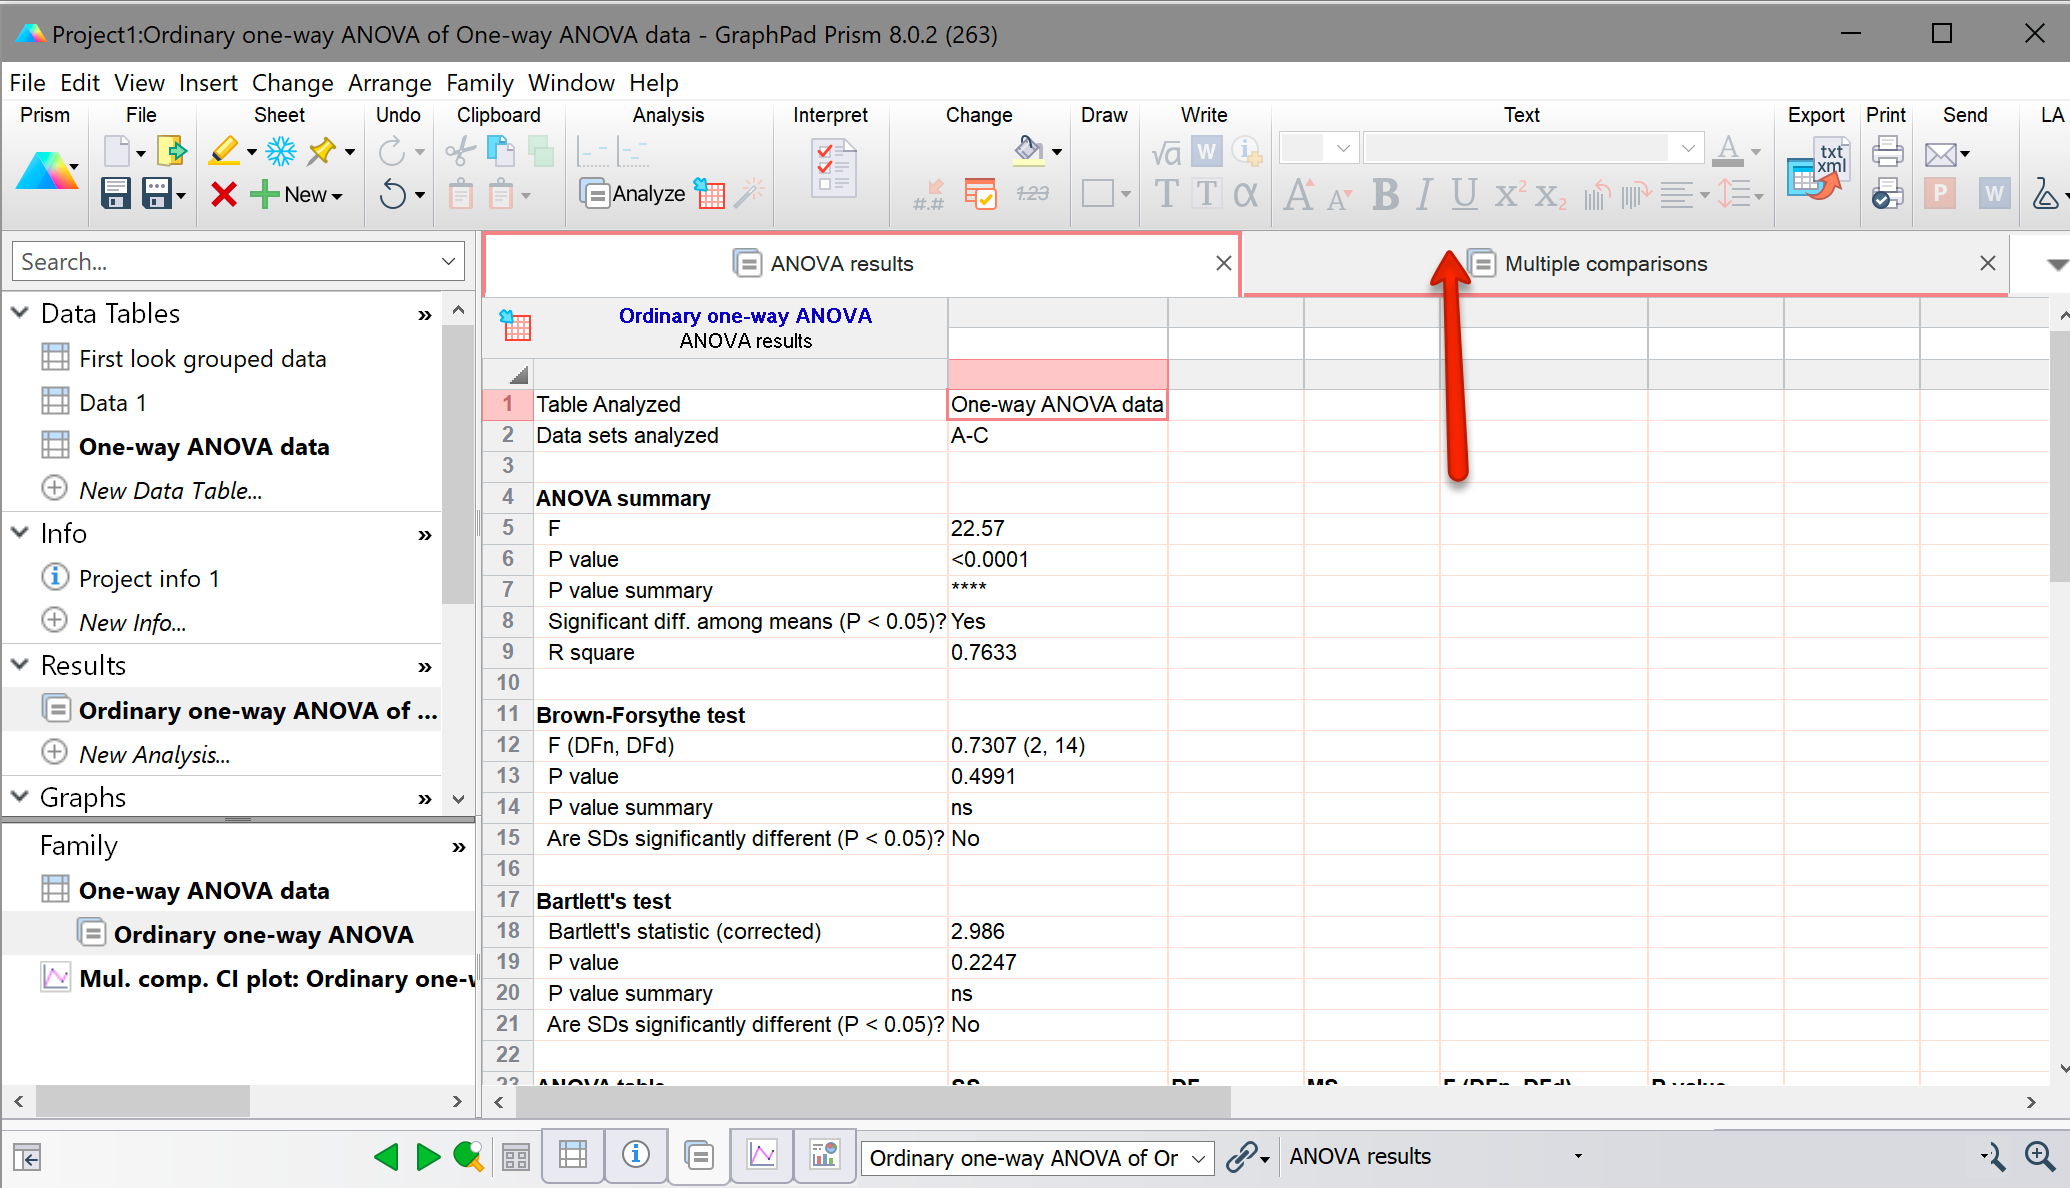
In Prism 8.2 the appearance of results tabs were updated, but are still found at the top of the results sheet.