|
Beware of using multiple comparisons tests to compare dose-response curves or time courses |
Scroll Prev Top Next More |
Does it make sense to use ANOVA multiple comparison tests to compare two dose-response curves at every dose (or two time course curves at every time point)?
No.
Two-way ANOVA can be used to compare two dose-response or time-course curves. The problem with this approach is that ANOVA treats the different doses (or time points) the same way it treats different species or different drugs. The fact that the different doses (or times) are sequential or numerical is ignored by ANOVA. You could randomly scramble the doses or times, and still get the same ANOVA results.
If you don't have enough data or enough theory to fit a curve, ANOVA might be a reasonable first-step in comparing curves. You get one P value testing the null hypothesis that all doses lead to the same effect, another P value testing the null hypothesis that all (both) treatments are indistinguishable, and a third testing whether there is interaction -- whether the difference between treatments is consistent at all doses. The first P value will always be tiny, and not very informative (of course the treatment does something). The second P value is the one you probably care most about, since it asks about differences between the two curves.
It is tempting to then run multiple comparison tests at each dose (or each time point) asking whether the difference between treatment groups is statistically significant. I don't see how these multiple comparison tests provide useful information. If you have two distinct dose-response curves, you expect to see tiny differences at low doses and large differences at intermediate doses. Does running a multiple comparison test at each dose help you understand your system? Does it help you design better experiments? I think the answer to both questions is almost always no.
What's the alternative? Use nonlinear regression to ask a focused question. In this case, use nonlinear regression to quantify the fold shift in the EC50 and its confidence interval, and to compute a P value that tests the null hypothesis that there was no shift. Details here.
Does it make sense to ask what is the lowest dose that produces a statistically significant difference?
No.
Some people want to focus on the low doses and ask: What is the lowest dose that produces a statistically significant difference between the two treatments? The term "significant" often clouds clear thinking, so let's translate that question to: What is the lowest dose where the data convince me that the difference between the two curves is due to the treatments and not due to chance? The answer depends, in part, on how many replicates you run at each dose. You could make that lowest- significant-dose be lower just by running more replicates. I don't see how helps you understand your system better, or how it helps you design better experiments.
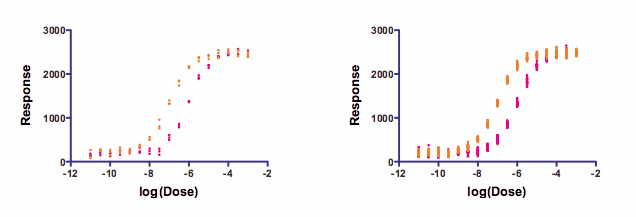
The simulated data below demonstrate this point. Both graphs were simulated using a four-parameter variable slope dose response curve with the same parameters and same amount of random scatter. The graph on the left had three data points per dose (triplicates). The graph on the right had 24 replicates per dose.

The data were analyzed with two-way ANOVA and the Bonferroni multiple comparison test.
For the graph on the left, the difference between the two data sets first became statistically significant (alpha =0.05 applied to the family of comparisons using Bonferroni) when the log(concentration) was -8.
In contrast, for the graph on the right, the difference first became statistically significant when the log(concentration) was -9. Concentrations between those two values (between 1nM and 10nM) caused a statistically significant effect in the right graph, but not the left.
I ran the simulations a few times, and the results were consistent, so this is not just a quirk of random numbers. Instead, it demonstrates that using more replicates allows smaller differences to be detected as "statistically significant".
By changing the experimental design, we could change the answer to the question: What is the lowest concentration where the response of the two drugs is statistically distinct? That suggests the question is not one worth asking.