Perform Calculations on the entire row or for each data set column individually
Compute one mean, median, etc. for the entire row
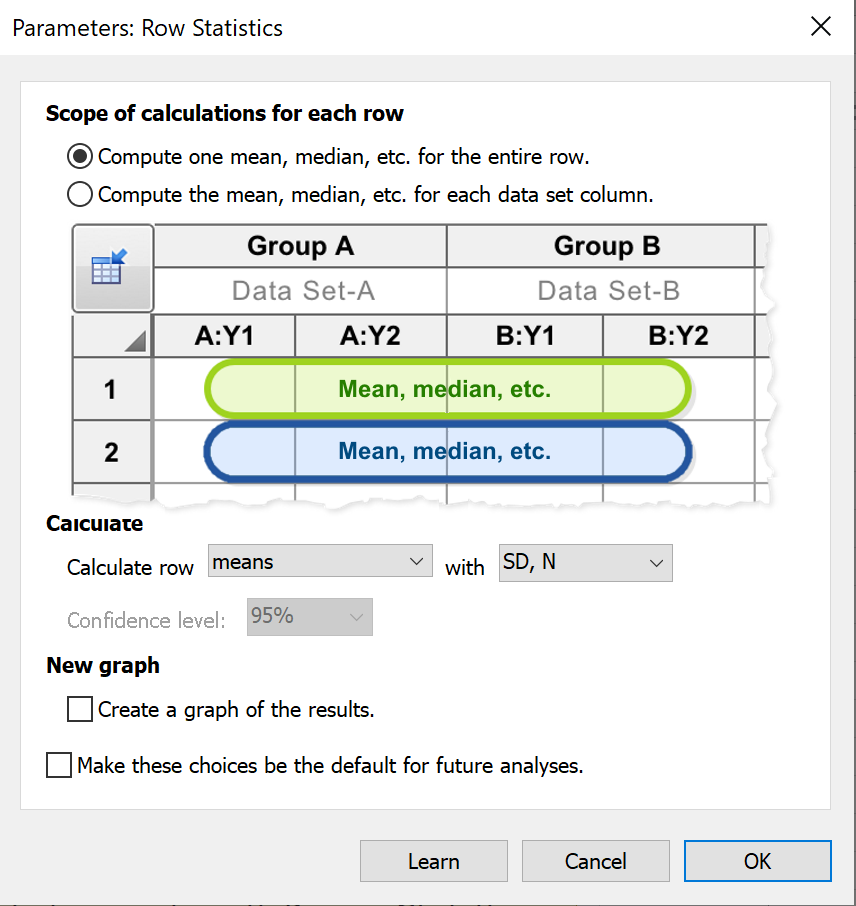
If data are entered into the table in only a single data set, or if each data set only has a single subcolumn of data, there's no ambiguity as to how Prism would perform the selected calculations. However, when data are entered into multiple data sets each with multiple subcolumns, Prism bases the resulting summary calculations for the row on the total/mean/median/etc. of each data set individually. For example, consider what would happen if you choose to calculate "Row means with SD" for three data sets that contain 3, 2, and 3 replicates respectively. The data in the first row may look like the following:
Data set A: {2, 3, 4}
Data set B: {4, 6}
Data set C: {7, 8, 9}
Prism will first compute the mean values for each data set, which are 3, 5, and 8. It then computes the grand mean of those three values (and the corresponding standard deviation) so that the results from this analysis are Mean = 5.333, SD = 2.517, N = 3.
If Prism simply looked at these eight values as independent values, it would have calculated a Mean = 5.375 and a SD = 2.504. However, since values in different data sets are unlikely to be independent, Prism does not perform this calculation.
Compute the mean, median, etc. for each data set column
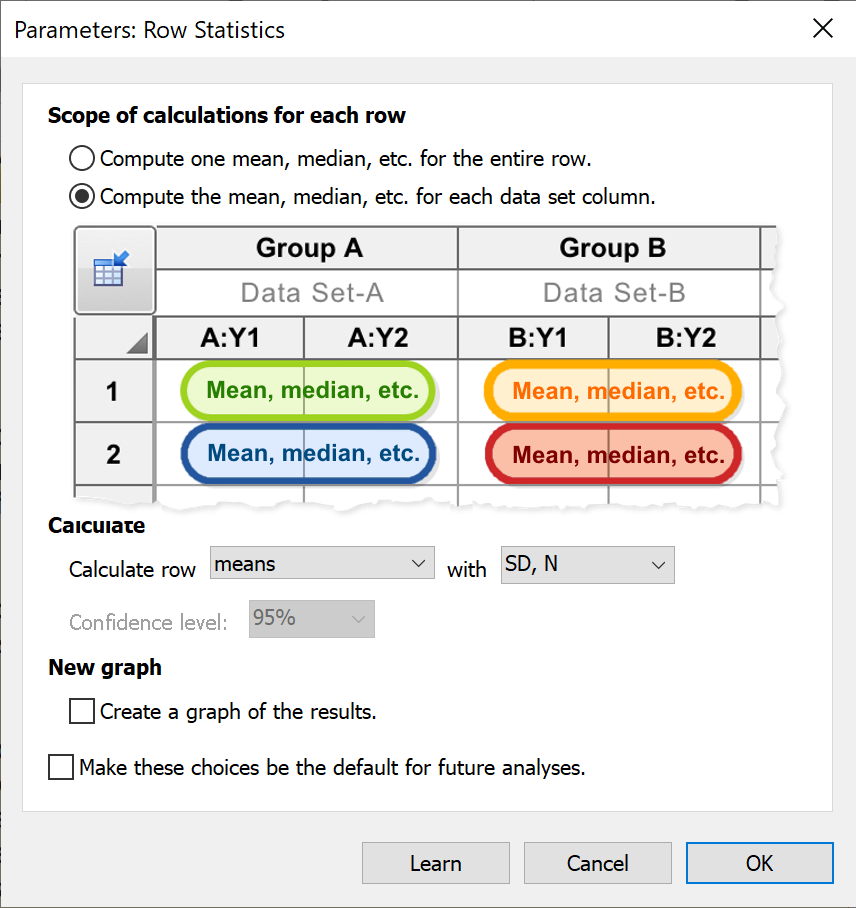
When data are entered into data sets that contain subcolumns, this option will instruct Prism to calculate a separate mean (or median, total, etc.) for each row within each data set. Note that you do not need to perform this analysis manually in order to graph the means or errors of your data, as Prism will handle this automatically when creating graphs of your data (you can use the Format Graph dialog to specify if Prism should display individual points or error bars for SD, SEM, 95% Confidence Intervals, or range). The primary purpose of this analysis is simply to generate a table of these summary (mean, median, etc.) and error (SD, SEM, etc.) values.
Specify the desired calculation
Choose to calculate row:
•Totals
•Means
•Medians
•Geometric Means
Based on the choice of value to calculate, additionally select how to report the calculated error:
Calculate |
Error Options |
Totals |
None |
Means |
•No error calculation •SD, N •SEM, N •%CV, N •Confidence Interval (CI) |
Medians |
•No error calculation •Quartiles •Min/Max •Percentiles |
Geometric Mean |
•No error calculation •Geometric SD •Confidence Interval (CI) |
Selecting either CI of Percentile as the error option will allow you to specify the desired confidence level or percentile for these calculations.
Create a new graph of the results
When selecting this option, Prism will automatically generate a new graph of the calculated results (with appropriate error values)