Overview
One of the assumptions of repeated measures ANOVA is called sphericity or circularity (the two are synonyms). Prism lets you decide whether to accept this assumption. If you choose not to accept this assumption, Prism uses the method of Geisser and Greenhouse to correct for violations of the assumption.
Should you assume sphericity?
Sphericity is defined below, but here are some guidelines for answering Prism's question about whether to assume sphericity:
•If your experimental design relies on matching rather than repeated measurements, then you can assume sphericity, as violations are unlikely.
•If your experiment design is repeated measures (multiple measurements over time), we recommend that you do not assume sphericity. We follow the recommendation of Maxwell and Delaney(1).
Defining sphericity
The name is confusing. Don't try to intuit what the term sphericity means by thinking about spheres. Mathematical statistics books define the term in terms of matrix algebra. That makes it seem confusing. But, in fact, the concept is pretty easy to understand.
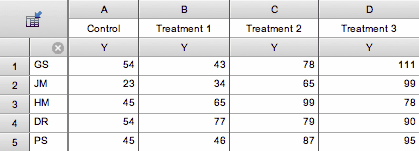
Here is the table of sample data from Prism (choose a Column table, and then choose sample data for repeated measures one-way ANOVA).

Each row represents data from one subject identified by the row title. Each column represents a different treatment. In this example, each of five subjects was given four sequential treatments. The data will be analyzed by repeated measures one-way ANOVA.
The assumption of sphericity states that the variance of the differences between treatment A and B equals the variance of the difference between A and C, which equals the variance of the differences between A and D, which equals the variance of the differences between B and D... Like all statistical assumptions, this assumption pertains to the populations from which the data were sampled, and not just to these particular data sets.
This is easier to see on a graph:

The left panel shows the differences. Each of the six columns represents the difference between two treatments. There are five subjects, so there are five dots for each difference.
The graph on the right shows the standard deviations. The assumption of sphericity states that the data were sampled from populations where these standard deviations are identical. (Most statistics books talk about variance, which is the square of the standard deviation. If the standard deviations are equal, so are the variances.) The standard deviations in the right panel above are not identical. That doesn't really matter. The assumption is about the population of values from which the data were sampled. In any particular samples, you expect some variation. Here the variation among the standard deviations is fairly small.
You might be surprised that the differences between nonadjacent columns are considered. Why should the difference between A and C matter? Or between A and D? The answer is that ANOVA, even repeated measures ANOVA, pays no attention to the order of the groups. Repeated measures ANOVA treats each row of values as a set of matched values. But the order of the treatments is simply not considered. If you randomly scrambled the treatment order of all subjects, the ANOVA results wouldn't change a bit (unless you choose a post test for trend).
References 2 and 3 below are clear, nonmathematical explanations of sphericity.
Compound symmetry
When you read about this topic, you will also encounter the term compound symmetry, which is based on the covariance matrix of the raw data (without computing paired differences). If the assumption of compound symmetry is valid for a data set, then so is the assumption of sphericity. But the reverse is not always true. It is possible, but rare, for data to violate compound symmetry even when the assumption of sphericity is valid.
What happens when the sphericity assumption is violated?
The assumption of sphericity would be violated when the repeated measurements are made in too short a time interval, so that random factors that cause a particular value to be high (or low) don't wash away or dissipate before the next measurement. To avoid violating the assumption, wait long enough between treatments so the subject is essentially the same as before the treatment. When possible, also randomize the order of treatments.
If the assumption of sphericity is violated, and you don't account for this in the calculations, then the P value reported by repeated measures ANOVA will be too small. In other words, the Geisser-Greenhouse correction increases the P value.
Quantifying deviations from sphericity
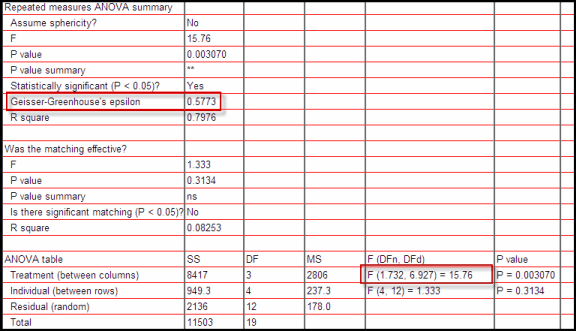
Prism quantifies deviation from sphericity by calculating and reporting the value of epsilon.
It seems like Prism should be able to decide whether to correct for violations of sphericity based on the value of epsilon. However, using this value to decide how to analyze the data is not recommended(1).
Repeated measures ANOVA without assuming sphericity
Prism can use the method of Greenhouse and Geisser to adjust the results of the repeated measures ANOVA to account for the value of epsilon. The only thing this adjustment does is reduce the number of degrees of freedom, which increases the P value.
Notes:
•This method is sometimes attributed to Box.
•Geisser and Greenhouse also derived a lower-bound correction. This is a simpler method to calculate, but corrects too far. Prism does not use this method, but instead uses the Geisser and Greenhouse epsilon hat method.
•Huynh and Feldt have developed an alternative method to perform repeated measures ANOVA without assuming sphericity. Prism does not compute this method, as Maxwell and Delaney prefer (slightly) the Geisser and Greenhouse method (1).
•The correction works by decreasing the values of the degrees of freedom. These revised values can be fractional, and Prism computes P from the F ratio and these revised fractional degrees of freedom.
•The correction works the same way if you fit data by fitting the mixed-model. The model is fit the same as would have been if you hadn't asked for the correction. The DF are decreased, so the P values computed from the F ratios are larger.
When looking at a printed page of Prism results, how can you tell if sphericity was assumed?
If sphericity was not assumed, you'll see that Prism reports a value for Geisser-Greenhouse epsilon, and that fractional df values are used to compute a P value.

Reference
1. Scott E. Maxwell, Harold D. Delaney, Designing Experiments and Analyzing Data: A Model Comparison Perspective, Second Edition. IBSN:0805837183.
2. Andy Field, A Bluffer's Guide to ... Sphericity.
3. T. Baguley, What is all this stuff about sphericity in my repeated measures ANOVA Output?