Viewing analysis tabs
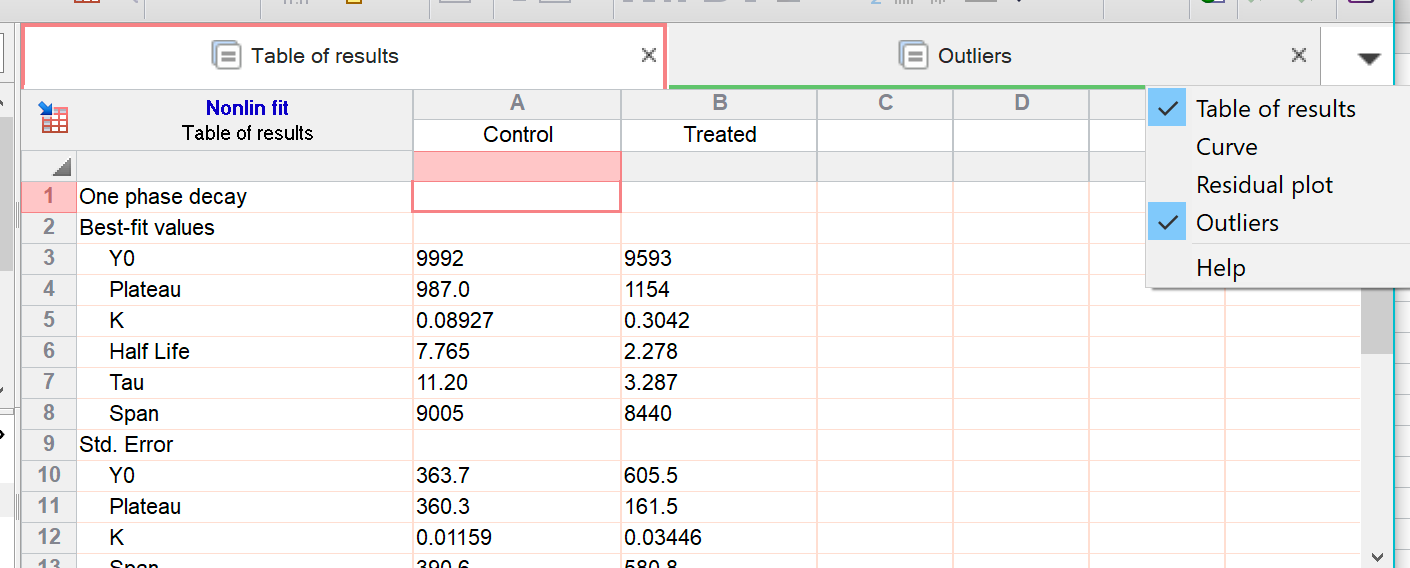
Many analyses in Prism present results on more than one table. Prior to Prism 8, these were called "views" or "subpages" of the results and they were shown indented under the main results entry in the Navigator. Starting with Prism 8, these tables are shown as analysis tabs. Here is a nonlinear regression results (with optional outlier detection) shown in a second tab.
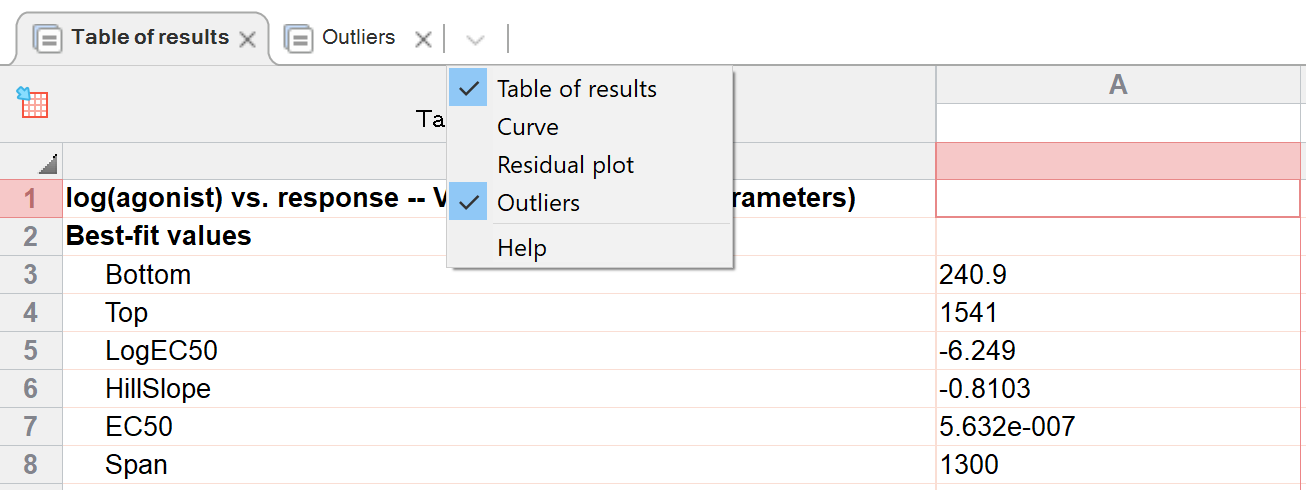
Note that the appearance of results tabs were updated in Prism 8.2. An example of the updated appearance can be seen below:
Notes:
•If the analysis has only one table of results, you won't see any analysis tabs.
•Some analysis tabs have a red border. These are tables to look at. But they can't be graphed or further analyzed because different rows have different kinds of data.
•Some analysis tabs have a green border. These are tables that can be graphed or analyzed further. Drop the New button and choose New Graph of existing data or New Analysis.
•You can hide analysis tabs by clicking the "X" in the analysis tab. Read on to learn about hidden tabs.
Hiding and unhiding analysis tabs
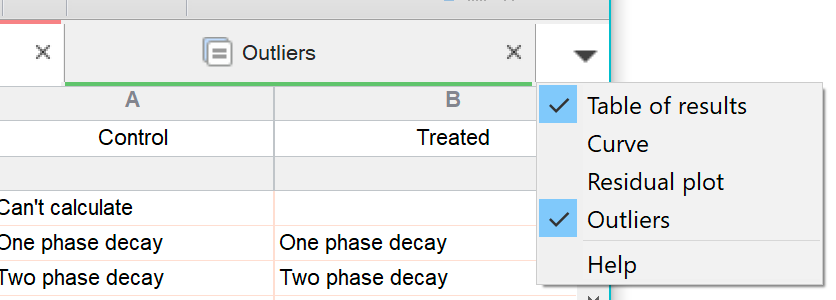
To the right of the analysis tabs is a downward pointing arrow. Click it to see the full list of analysis tabs, including those that are hidden. The analysis in the screenshot below has four analysis tabs. Two are visible (checked) and two are invisible (unchecked).
Why are some results tabs hidden by default?
Some analyses create results tables that are used to create graphs, and there is really no point in viewing these tables. For example, nonlinear regression can creates a results tab showing the XY coordinates of the curve and another showing the residuals, Prism (starting with Prism 8) hides these results tabs by default since you will probably only want to look at the linked graph, and not the table of values. But you can choose to show these tabs if you want to.
Why would you choose to hide other tabs?
You can hide any results tabs you want to. If you are preparing a file for others to view, you may want to hide some less important analysis tabs. For example when interpolating standard curves, you may want to hide the tabular results. Another example: If you do an ANOVA but only care about the followup multiple comparisons tests, you may want to hide the main results table with the ANOVA results.
How to hide a tab
You can make any analysis tab invisible by clicking the "X" on the tab, or unchecking that tab in the list of tabs. This can be useful when you are preparing a file to show others. Maybe the whole point of regrssion was to interpolate unknowns, so you only want the interpolated results to be visible and want everything else to be invisible. Or maybe you did ANOVA followed by multiple comparisons, but you want to hide the main ANOVA results so as to put the focus on the multiple comparisons results.
How to make a tab visible
Any hidden analysis tab can be made visible again by checking the option box in front of its name.
Keyboard shortcuts
Windows: Hold Control and click Tab to move to the next analysis tab
Mac: Hold Command and press [ to move to the next analysis tab, ] to move to the prior one.