XY and Grouped graphs
When you create an XY or Grouped table, you can choose to include side-by-side subcolumns. For example, this table was set up with three side-by-side subcolumns:
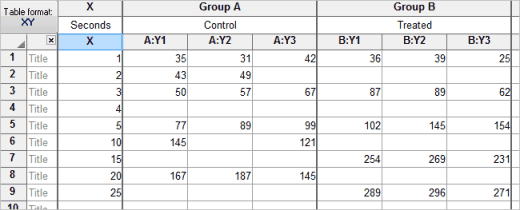
Prism can plot the raw data (each replicate) or can plot error bars it computes. You don't need to run any analyses to compute the SD or SEM (etc.). Prism does the calculations itself and plots the error bars.
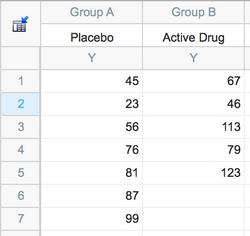
Column graphs
Replicates are entered into a stack in each column. There are no subcolumns.
Nested graphs
Replicates are stacked into each subcolumn.
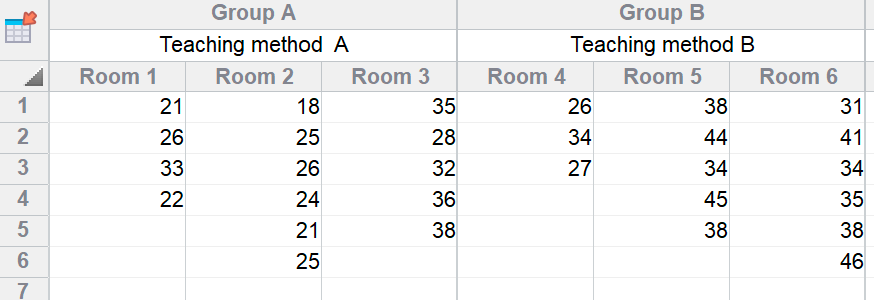
Note the big difference between nested and grouped tables. Replicates are placed on side-by-side subcolumns on Grouped tables, but are stacked in a subcolumn on a Nested table.