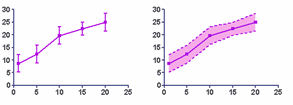
In some cases you may prefer to plot the error values as error envelopes, as shown on the right below, rather than error bars (left).
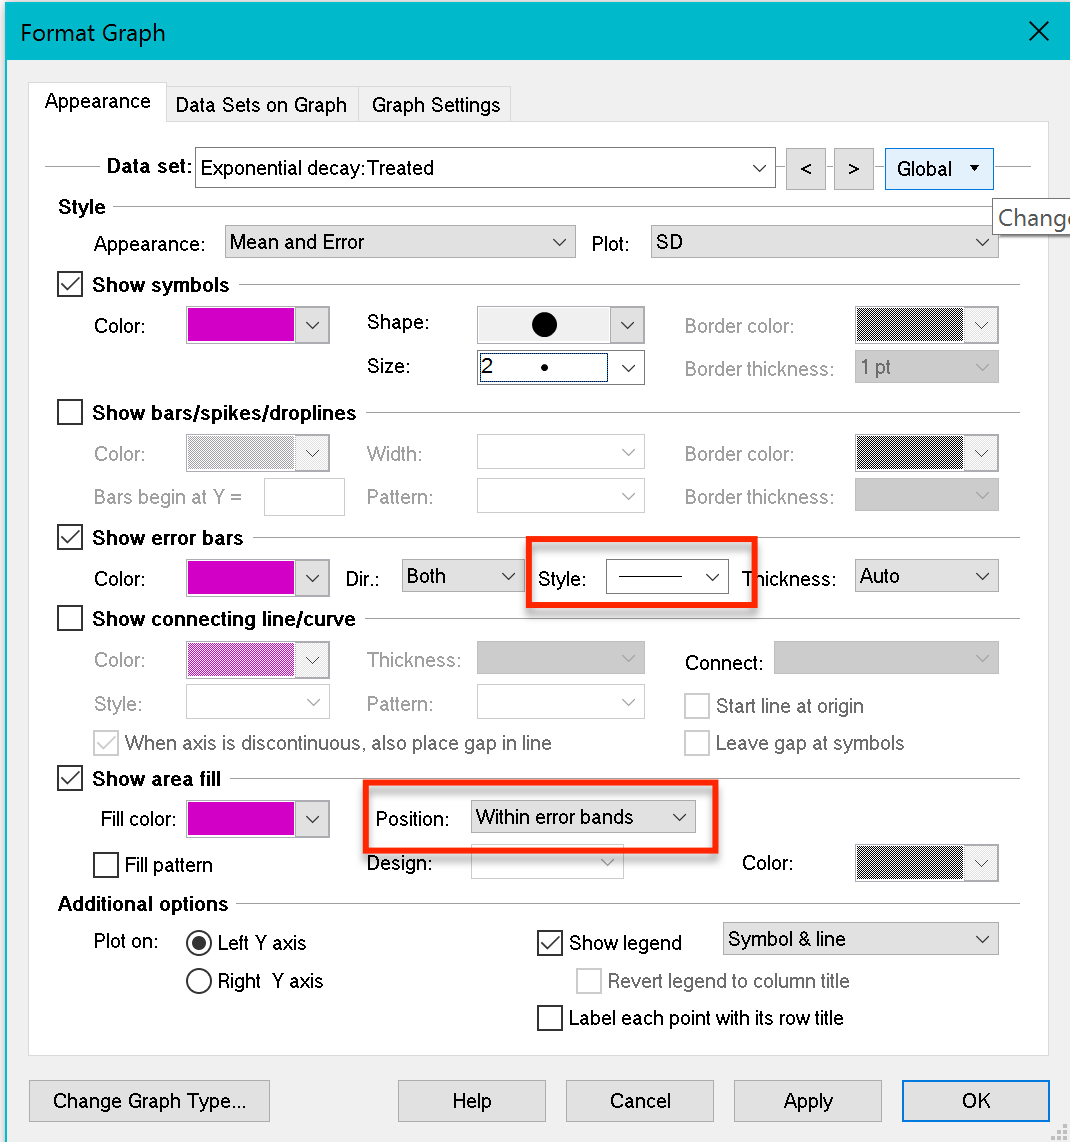
To plot error envelopes on an XY graph, on the first tab of Format Graph make two settings:
1.Drop the error bar style drop down and choose one of the two horizontal line choices (solid or dotted).
2.Check the option to show area fill, choose a color, and choose to put the fill within the error bands.