A multiple variable table is arranged in the way that most statistics programs organize data. Each row is an "observation" (experiment, animal, etc.). Each column is a different variable. There are no subcolumns in multiple variable tables.
Analyses performed on multiple variable data
•Correlation matrix
•Multiple linear regression
•Multiple logistic regression
•Principle Components Analysis (PCA)
•Extract and rearrange portions of the data onto a new table
•Transform and select
•Identify outliers
•Descriptive statistics
Example of a multiple variable table
The example below shows the first few rows of data from a clinical trial about diabetes. Each row represents one person studied. Each column is a different variable measured.
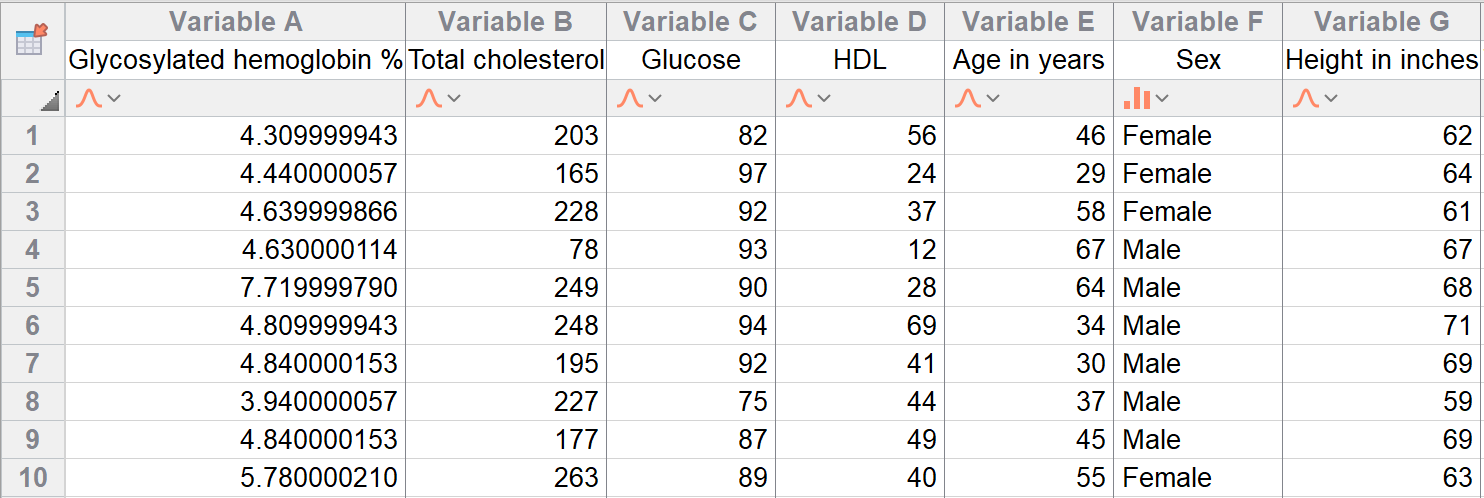
Prism does not automatically graph these kinds of tables, but a graph showing the variables of your choice can be made by clicking the Create New Graph button in the Sheet section of the toolbar.
Prism does not require that you encode categorical variables. For example, in the data above, Sex can be entered directly as "Male" and "Female" (or "M" and "F") and does not have to be entered as "0" and "1". Prism will encode these categorical variables for you as part of performing analyses on the data.
.