At the top of the Connecting Line Options page, the Show Connecting Lines checkbox will toggle on or off connecting lines on the graph (on Mac, this is a toggle as opposed to a checkbox).
The next set of options on this page allows you to choose between three different styles of connecting lines: Connecting lines (from origin), Connecting lines, and Vector plot. Each of these three options will be described below:
•Connecting lines (from origin): a line will begin at the origin (defined by additional options on this page), and will connect to the first point on the graph (or the first point in each group). From this point, the line will connect to the next point on the graph (or the next point in the group) and so on.
•Connecting lines: a line is plotted identically to the way Connecting lines (from origin) is described above, except that the line STARTS from the first point on the graph (or the first point in each group).
•Vector plot: A separate line is drawn starting from the origin (defined by additional options on this page) to each point on the graph.
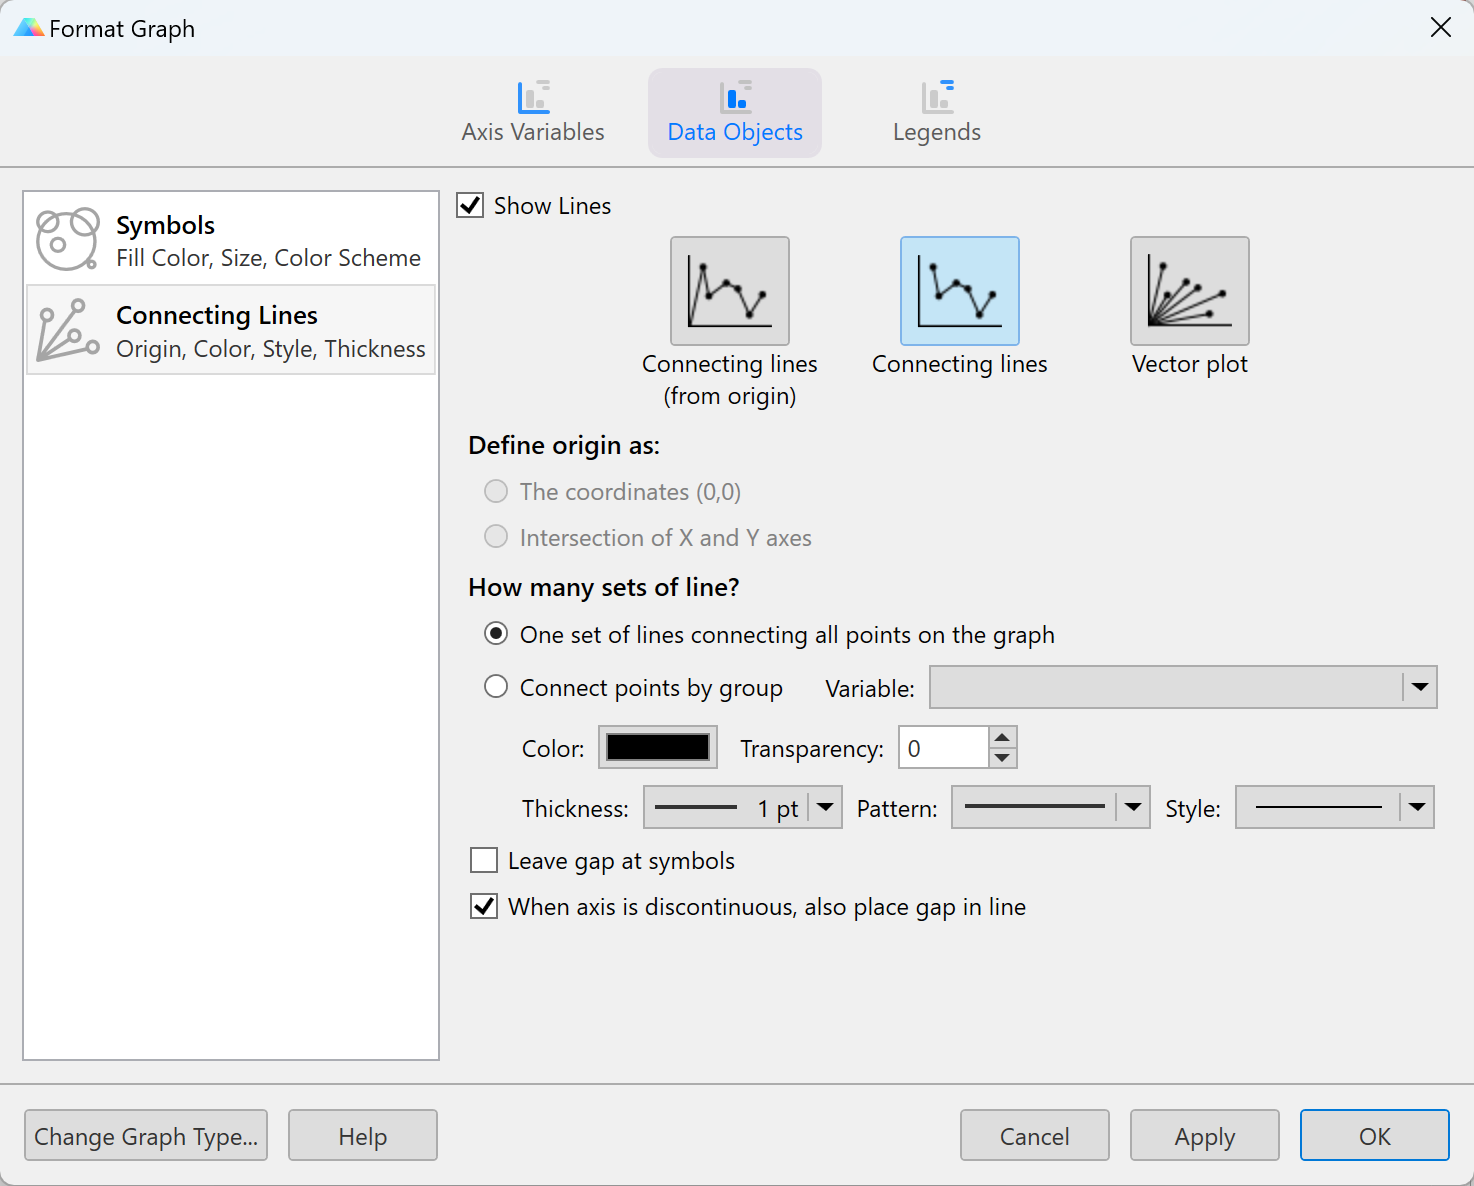
Note that for both Connecting Lines (from origin) and Vector plot, it is important to understand what is meant by the term ‘origin’. The next set of options on this page allows you specify where Prism should define the origin:
•Define the origin as the coordinates (0,0). Connecting lines will begin from this location, regardless of where it is located in relation to the X and Y axes
•Define the origin as the intersection of X and Y axes. Connecting lines will begin where these two axes meet, even if this intersection happens at a coordinate location other than (0,0)
If you choose the connecting line style Connecting lines, the location of the origin is not needed, and so these options will be disabled.
In addition to specifying the style of connecting lines you would like to use, you will also need to specify how many groups of lines Prism should draw. You can choose between drawing One set of lines for all points on the graph or to Connect points by group. With the first option, all of the plotted points on the graph will be considered a single group, and the connecting line style chosen at the top of this options page will be applied to the points as a single group. Additional options will allow you to specify the Color, Transparency, Thickness, Pattern, and Style of the connecting lines using the appropriate dropdown menus.
Selecting Connect points by group allows for customization of the appearance of different sets of connecting lines on the graph (or different sets of vector lines). Select a categorical variable from the Variable dropdown menu, then assign Color, Transparency, Thickness, Pattern, and Style options using the appropriate dropdown menus for each level separately. Additionally, multiple groups (multiple levels of the selected categorical variable) can be customized at once using the Global dropdown menu.
Finally, two checkbox options are available that allow for additional customization of the connecting lines drawn on the graph. These are Leave gap at symbols (causing Prism to leave a break in the connecting line when it connects to a symbol on the graph), and When axis is discontinuous, also place gap in line. If using a segmented axis, it is recommended to leave this second option enabled.