Features and functionality described on this page are available with our new Pro and Enterprise plans. Learn More... |
The Level Order tab in the Format Graph dialog controls the display order of levels for each categorical variable on a Multiple Variables graph. Use this tab to change the order in which levels appear on categorical axes and in legends, independently of the order defined in your data table.
This feature requires a Prism Pro license.
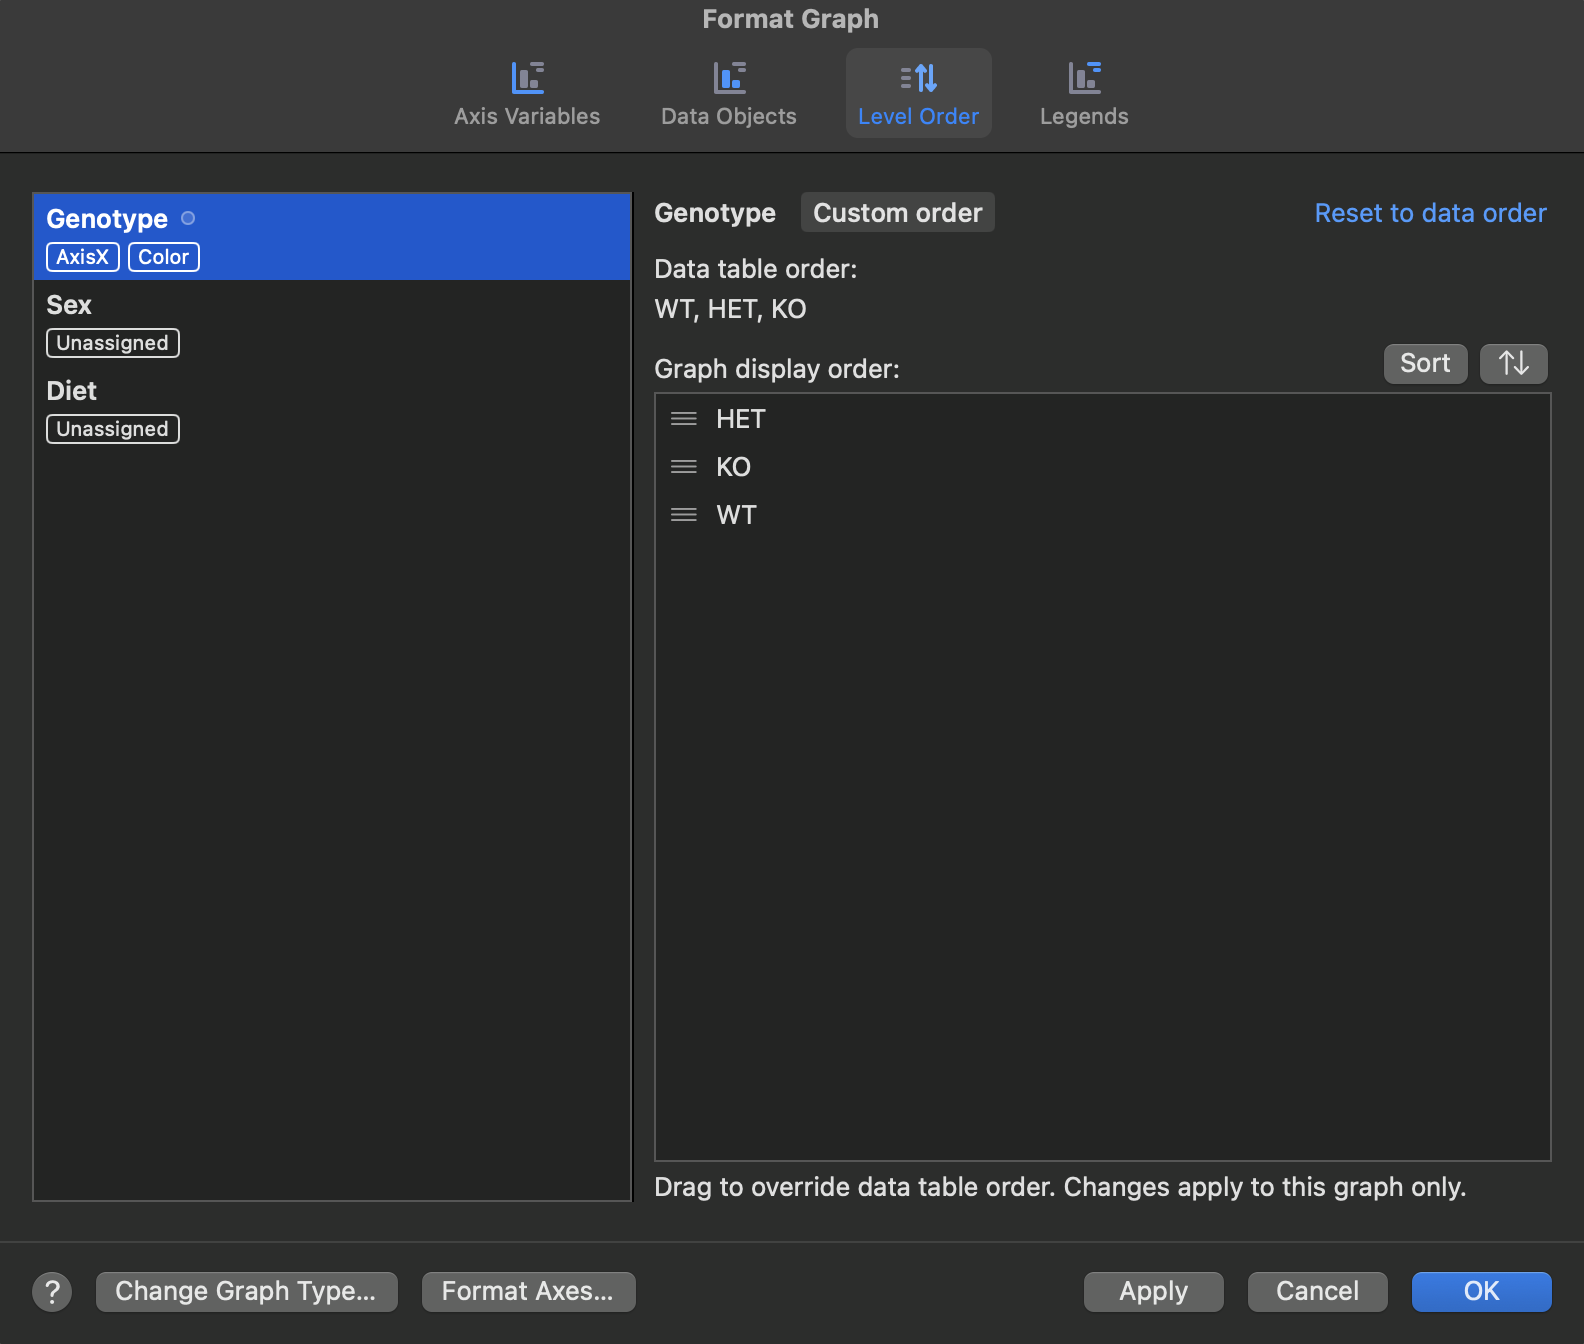
How level order works
Prism maintains two separate orderings for each categorical variable:
•Data table order -- the sequence of levels defined on the data table, managed through the Format Data Table dialog. This is the primary, shared order that all graphs inherit by default.
•Graph-level order -- the display order on a specific graph. By default this is live-linked to the data table order, so any changes at the table level propagate to the graph automatically. You can override it locally on any individual graph using the Level Order tab.
Changing the graph-level order on one graph does not affect any other graph or the data table order.
Using the Level Order tab
The Level Order tab shows one section per categorical variable used on the current graph. Select a variable from the list on the left to view and modify its level order.
Each variable's panel contains:
•Level list with drag-and-drop handles -- drag rows to reorder levels manually. Each row shows the level label as it appears on the graph.
•Sort actions -- one-time commands to set a preset order: Entry Order, Name Order, Row Order, or Frequency Order. These commands act on the graph-level order only and do not change the data table order.
•Data Table Order reference -- shows the current order defined at the data table level so you can compare it with the graph-level order.
•Live-link indicator -- a visual indicator showing whether this graph's order is currently live-linked to the data table order or has a local override active. When a local override is active, an option to re-sync is provided.
Breaking and restoring the live link
Any manual reordering on this tab -- whether by drag-and-drop or a sort action -- breaks the live link. The live-link indicator updates to show that a local override is active. Undo restores both the previous order and the live-link state.
To restore automatic synchronization with the data table, click Reset to data order. This resets the graph-level order to match the current data table order and re-establishes the live link. From that point forward, any changes to the data table order propagate to the graph automatically.
Level order and colors
Changing the level order on this tab does not change which color is assigned to each level. Colors are set when a color scheme is applied and are associated with each individual level -- not with its position. A level that moves from position 1 to position 3 keeps its original color.
If you want colors to reflect the new order, re-apply the color scheme after reordering. This writes a new color assignment based on the current order at that moment.
Reordering levels from the graph
You can open the Level Order tab directly from the graph: right-click any categorical color or size legend and choose Reorder Levels... The Format Graph dialog opens with the Level Order tab displayed, pre-selected for the categorical variable associated with that legend.
Setting data table level order
To change the level order for a categorical variable at the data table level -- which affects all live-linked graphs at once -- use the Level Order section in the Format Data Table dialog. Select the variable on the Variable Types tab, then use the drag-and-drop handles or sort action buttons to reorder its levels. Sort actions are one-time commands that set a new static order; they are not persistent rules.
Compatibility with earlier versions of Prism
Files that use custom level ordering cannot be saved in the legacy .pzfx format. Save in .prism format to preserve level order settings.
When a file containing custom level order is opened in an earlier version of Prism, the ordering is not recognized and graphs are redrawn using entry-based order. If the file is resaved in the earlier version, the level order settings are lost.
Analyses that depended on level order -- such as t tests and multifactor ANOVA -- and were created in an earlier version of Prism will appear frozen when the file is opened in the latest versions of Prism. A floating note explains why the results are frozen and what will happen if they are unfrozen and recalculated using the current level order.