On a survival table, you enter information for each subject. Prism then computes percent survival at each time, and plots a Kaplan-Meier survival plot (and also compares survival with the log-rank and Gehan-Wilcoxon tests).
Analyses performed with survival data
There is one survival analysis in Prism that gives you choices for any of these analyses:
•Kaplan-Meier
•Log-rank test
•Wilcoxon-Gehan test
Example of a survival table
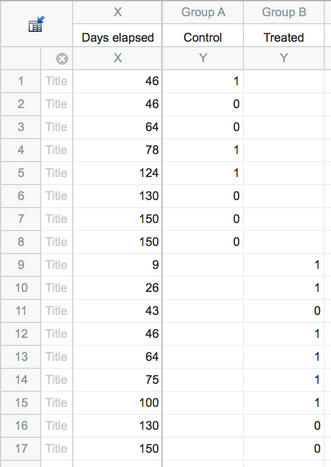
Each row represents a distinct subject. (You can optionally use row titles to identify the subjects.) Each column represents a treatment.
Notes:
•Enter elapsed time (usually in days) as X (Prism does not let you enter dates).
•For each subject, enter a code for Y:
•Enter ‘1’ for a subject if the event (death) occurred at the time entered into X.
•Enter ‘0’ if the data are censored. Data are censored when you simply don’t know what happened to the subject after that time, or do know but can’t use the information.
•You'll find a more complete discussion of entering survival data and interpreting the results in the statistics guide.
Error bars
When Prism plots a survival curve, it can include SE or 95% CI error bars. These are computed as part of the Kaplan-Meier method for creating the survival curve. You can't enter error values directly -- they are computed from all the data.