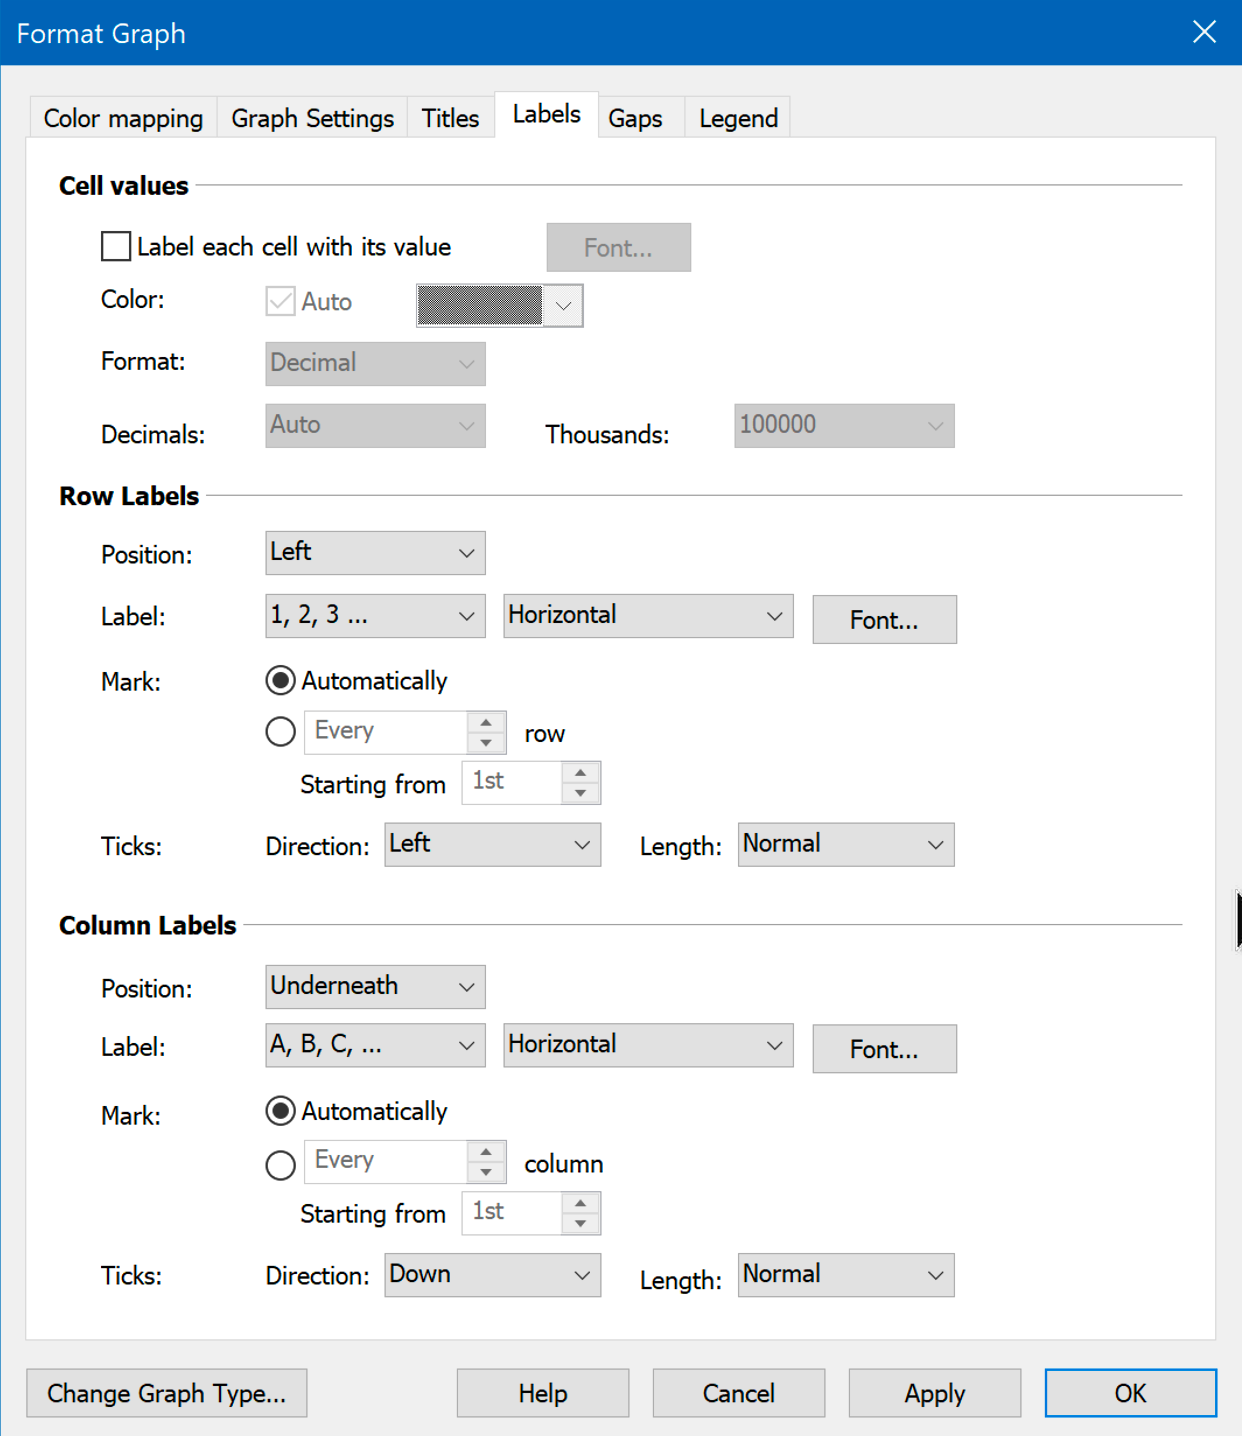
Choose whether to write the numerical value (or the mean, median, etc) of each cell in that cell, and how to label the two axes.
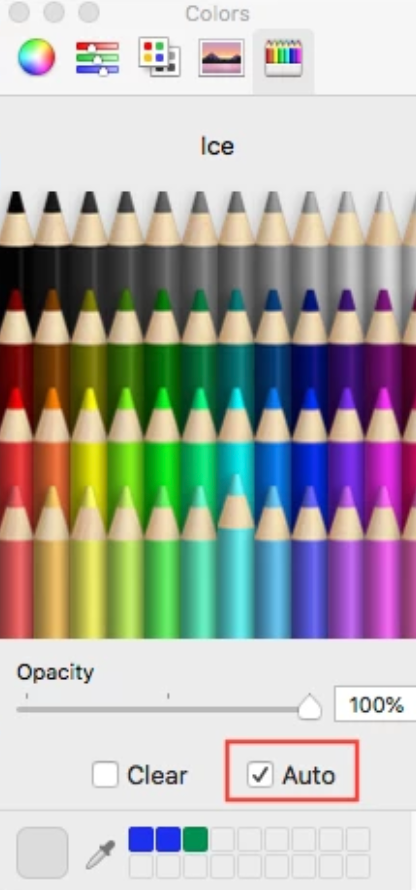
If you place the value in each cell, choose one color for all values or choose "auto" so the colors are either black or white depending on the cell color. With Prism Windows, the auto choice is in the Format Graph dialog as shown above. With Prism Mac, the auto choice is in the color picker as shown below.