What is hooking?
When Prism performs an analysis, the results remain 'linked' to the original data. This means that any change to the data will automatically update the results that Prism has generated. Additionally, Prism allows you to 'hook' the results of most analyses into various places throughout the application:
•Into parameters dialogs of other analyses
•Into graphing dialogs
•Added to graphs as text objects
The value that you 'hook' to will be used in that analysis or graphing choice, or will be displayed on the graph where you place it. Because Prism's results remain 'linked', the value that you hook to will automatically be updated if the data are edited or (in some cases) if the analysis parameters are changed.
You can also hook to constants entered on an Info sheet.
Which analysis results can be hooked?
Nearly all Prism analyses generate results that can be hooked to. As a rule of thumb, if an analysis generates a "red" results sheet, it will also generate results that can be hooked to using the Analysis Constant/Hook Constant dialog. The analysis list includes:
•One-way ANOVA
•Two-way ANOVA
•Three-way ANOVA
•Area under curve
•Bland-Altman method comparison
•Chi square analysis
•Correlation
•Cox proportional hazards regression
•Deming regression
•Descriptive statistics
•Interpolation
•Kaplan-Meier survival analysis
•Multiple comparisons
•Multiple linear regression
•Multiple logistics regression
•Multiple t tests
•Nested ANOVA
•Nested t test
•Nonlinear regression
•Normality and lognormality tests
•One sample t test
•Outlier analysis
•Principal Component Analysis (PCA)
•ROC curve analysis
•Simple linear regression
•Simple logistic regression
•t test
How to hook?
You'll see hook icons  on many dialogs next to fields requiring you to enter a value. Click, and then choose an analysis constant (or info constant) on the Hook dialog.
Example 1. QC plot

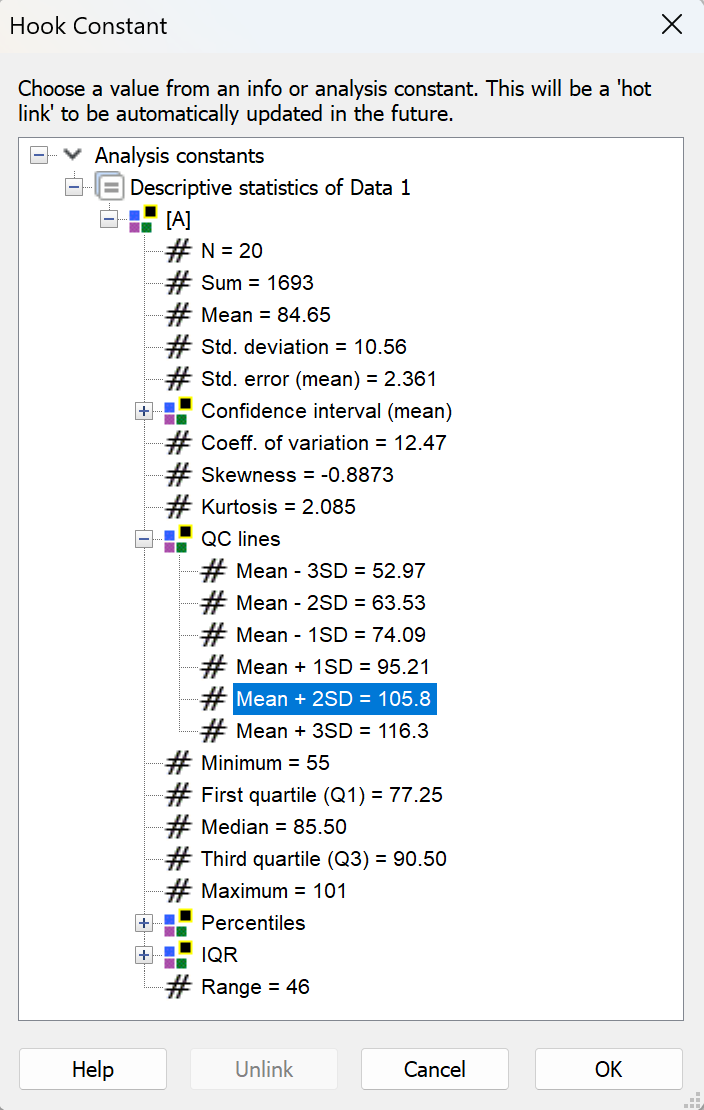
The graph shows repeated quality control measurements. The descriptive statistics analysis was run to compute the mean and SD (and more) of the values. The lines at the mean and plus or minus two standard deviations were drawn by hooking these values. This means that the grid lines will move as more data are entered into the data table.
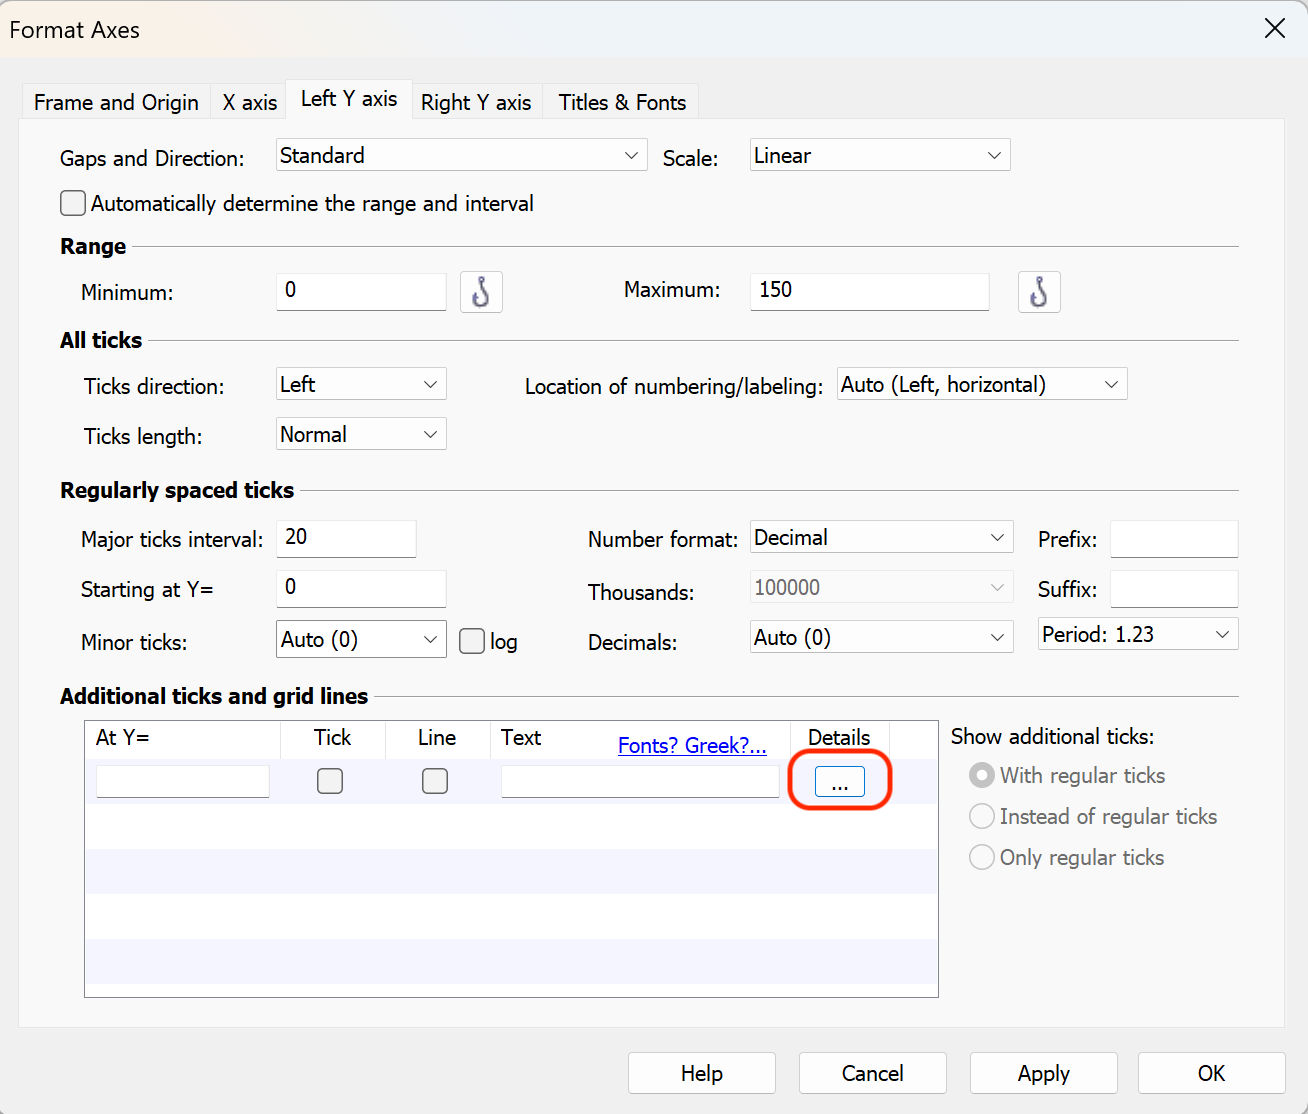
First double click on the Y axis to bring up the Format Axes dialog on the Y axis tab. The bottom of the dialog lets you add additional ticks and grid lines. To hook the grid line to an analysis constant requires drilling down to the details dialog, so click the '...' button.
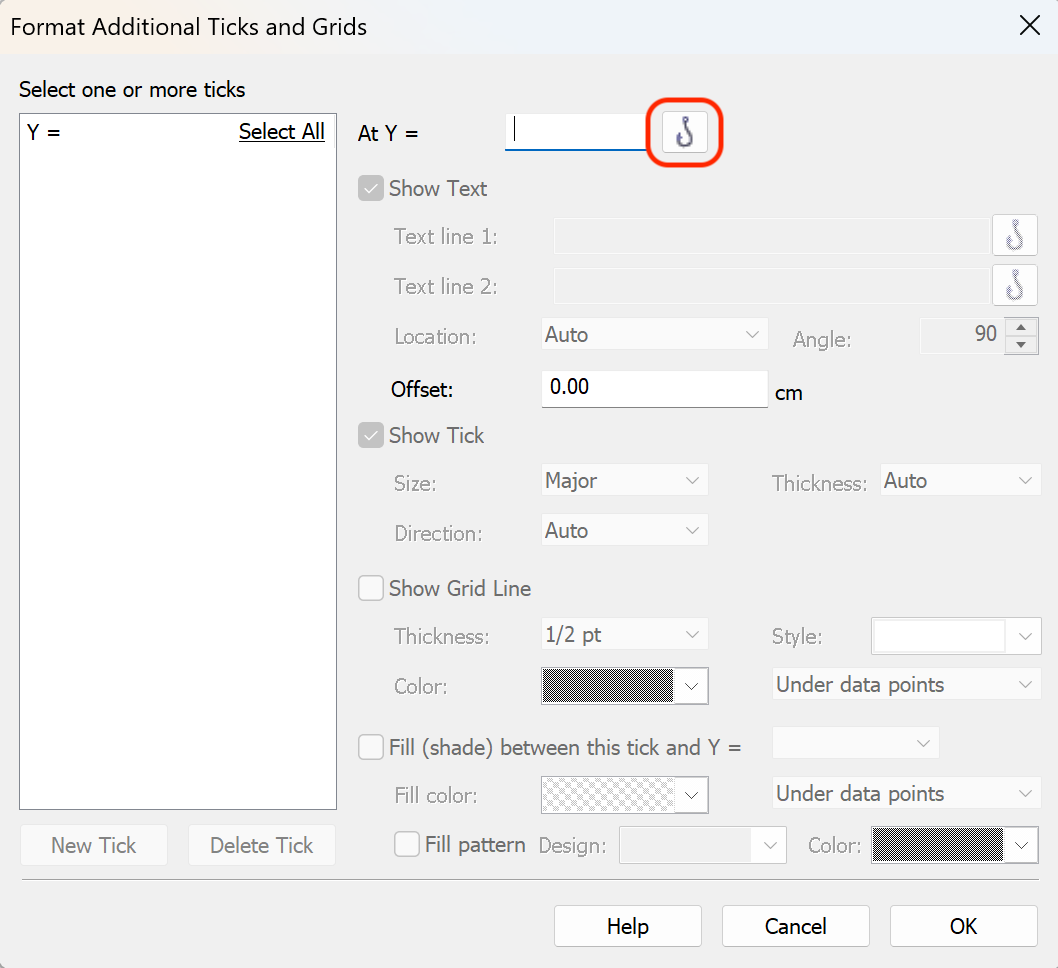
You don't want to enter a Y coordinate on the Format Additional Ticks and Grids dialog. Instead you want to hook an analysis constant. Click on the hook button, and then choose the value you want to hook (first the mean, later the two QC control lines). Back on the Format Additional Ticks and Grids dialog, choose the kind of line (solid or dotted) and its color. You can also choose to fill between the two QC lines
Example 2. Confidence interval of EC50
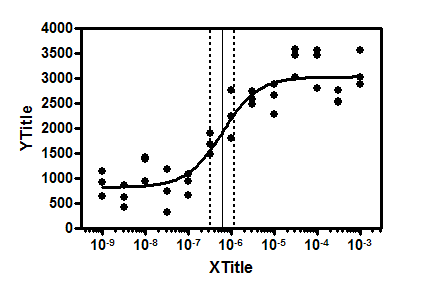
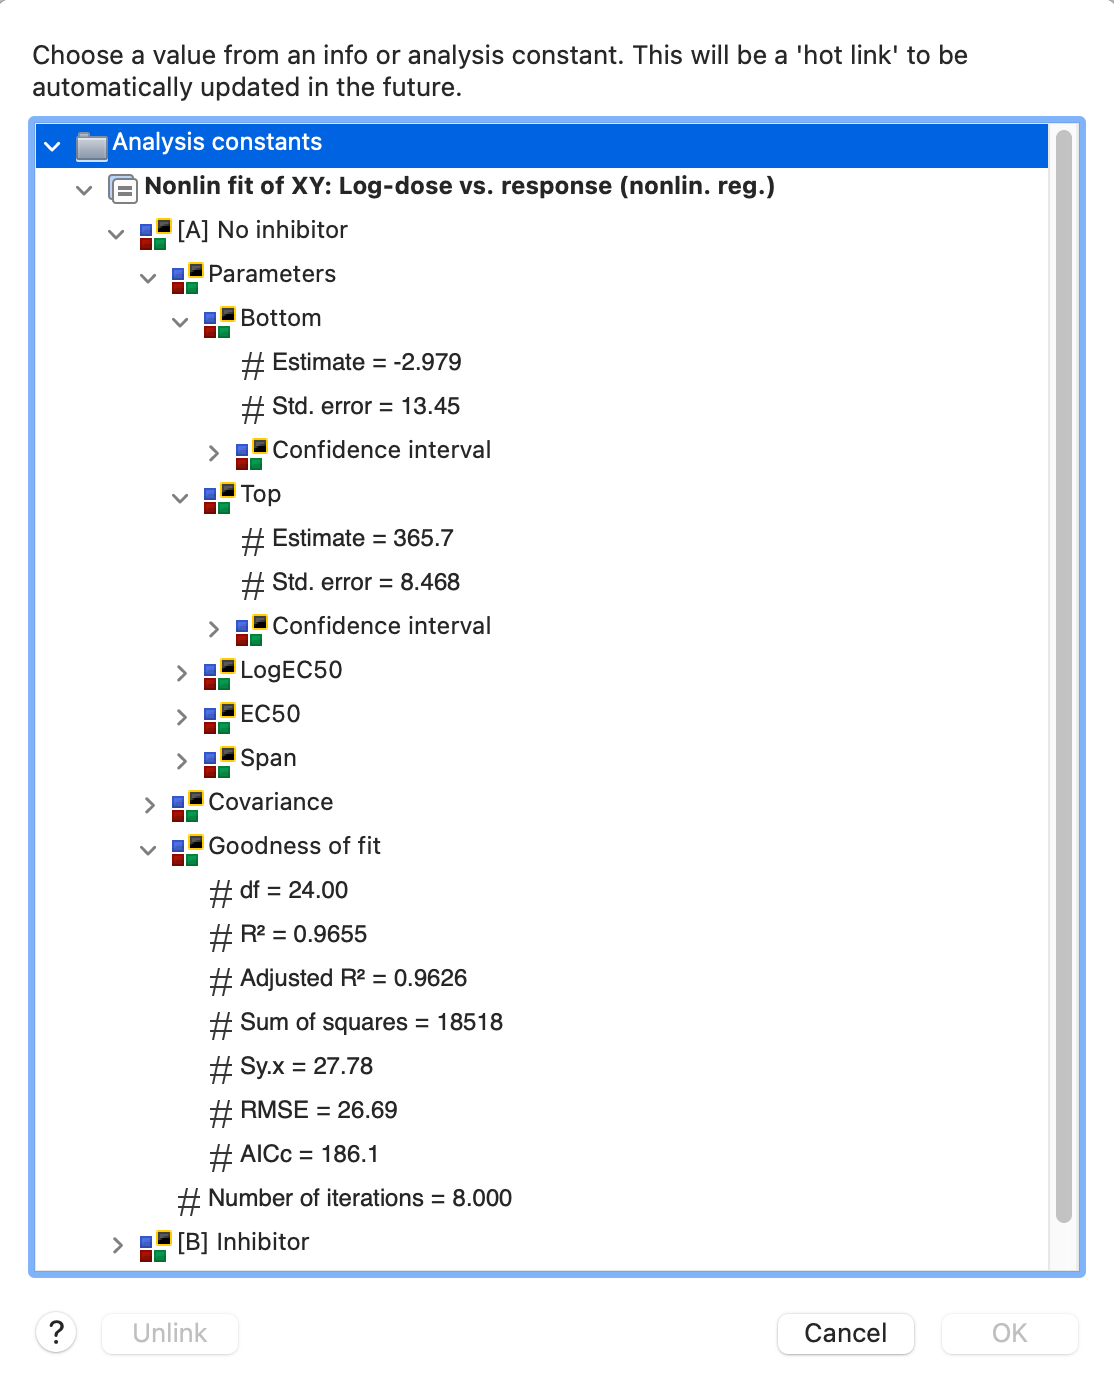
This example shows grid lines at the EC50 along with its 95% confidence interval. All three values were 'hooked' from the nonlinear regression using Additional ticks and grid lines, so will move if data are edited or replaced.
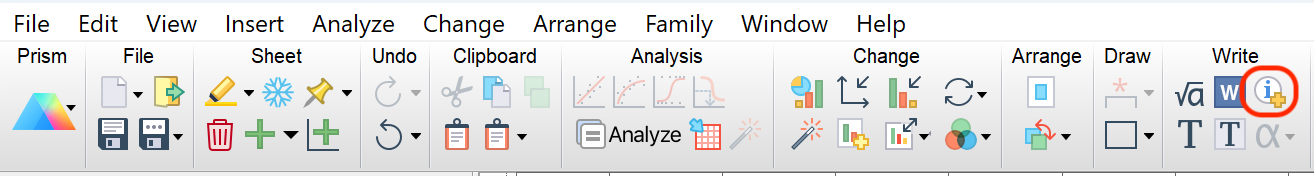
Example 3. Adding a nonlinear regression model equation to the graph
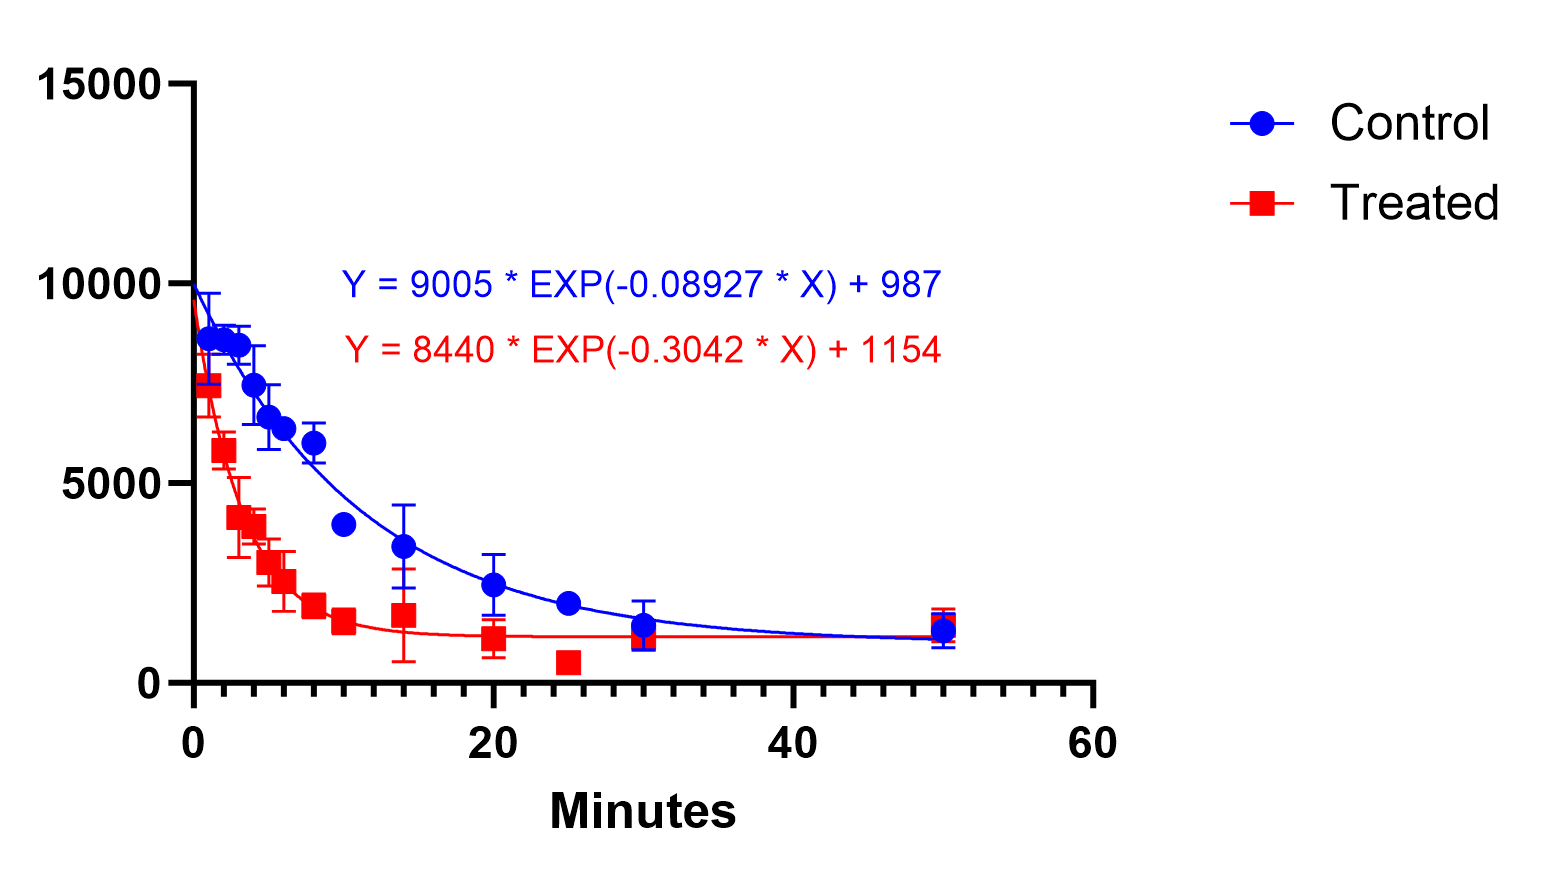
This example demonstrates how a nonlinear regression model equation can be added to the graph with the best-fit parameter values included in the equation. After creating and customizing your graph, open the Hook Constant dialog by clicking on the "Insert info or analysis constant" button in the toolbar.
Select the equation in the analysis constant dialog and click "OK"
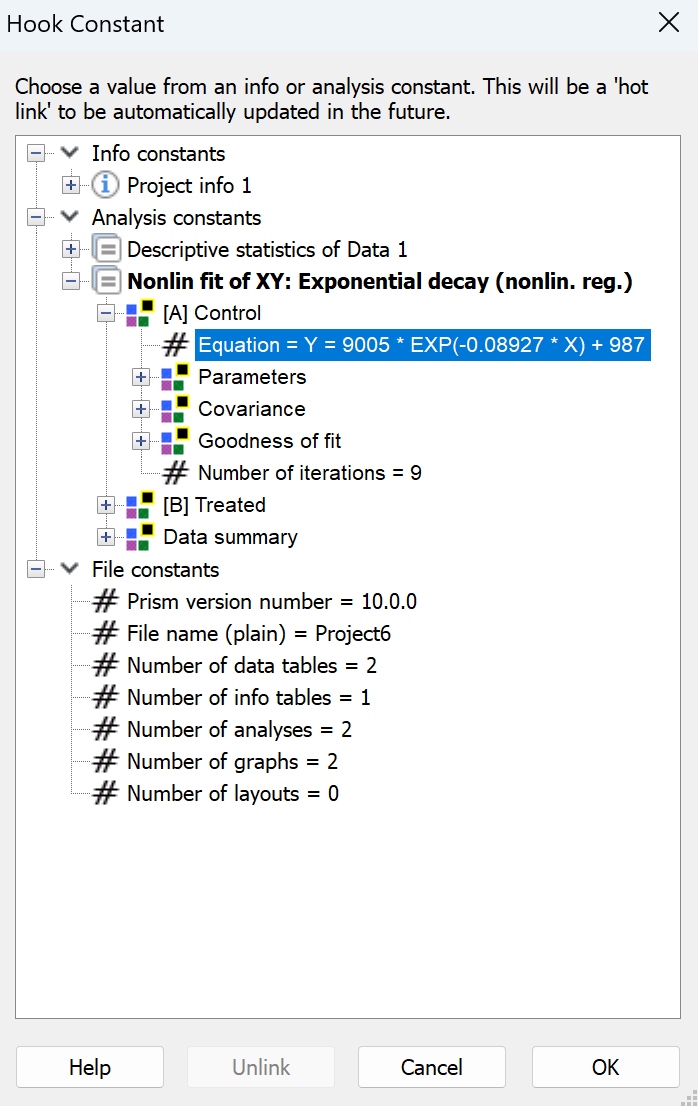
Now the equation will be entered and you can customize the text (font size, color, and location) as you'd like. Repeat this for each model equation you'd like to add.