Overview of McNemar's test
In the usual kind of case-control study, the investigator compares a group of controls with a group of cases. As a group, the controls are supposed to be similar to the cases (except for the absence of disease). Another way to perform a case-control study is to match individual cases with individual controls based on age, gender, occupation, location and other relevant variables. This is the kind of study McNemar's test is designed for.
Displaying and analyzing data from matched case-control studies on an ordinary contingency table obscures the fact that the cases and controls were matched. Matching makes the experiment stronger, so the analysis ought to take it into account.
Example
Here are some sample data:
Control |
||||
+ |
- |
Total |
||
Case |
+ |
13 |
25 |
38 |
- |
4 |
92 |
96 |
|
Total |
17 |
117 |
134 |
|
The investigators studied 134 cases and 134 matched controls, for a total of 268 subjects. Each entry in the table represents one pair (a case and a control). The + and - labels refer to people who were, or were not, exposed to the putative risk factor or exposure.
This is not a contingency table, so the usual analyses of contingency tables would not be helpful. It turns out that the odds ratio can be computed quite simply. The 13 pairs in which both cases and controls were exposed to the risk factor provide no information about the association between risk factor and disease. Similarly, the 92 pairs in which neither case nor control were exposed to risk factor provide no information. The odds ratio is calculated as the ratio of the other two values: pairs in which the case was exposed to the risk factor but the control was not divided by pairs in the control was exposed to the risk factor but the case was not. In this example, the odds ratio for the association between risk factor and disease is 25/4 = 6.25. The equation for the confidence interval is complicated (see page 286 of S. Selvin, Statistical Analysis of Epidemiologic Data, 2nd edition). The 95% confidence interval for the odds ratio ranges from 2.158 to 24.710.
Computing the P value with Prism using the Binomial test
When you read about McNemar's test, most books explain how to do a chi-square calculation. Prism won't do that, but we offer a free web calculator that does. The binomial test asks the same question, but is more accurate, especially with small studies. Follow these steps with Prism:
1. Create a parts-of-whole data table.
2. Enter the numbers of discordant pairs in the first two rows of column A. For the example, enter 25 and 4.
3. Click Analyze and choose the analysis that compares observed and expected counts.
4. Choose to enter the expected values as percentages, and enter 50 as both expected percentages.
5.Choose the binomial test, rather than the chi-square test.
6. For the sample data, the P value is less than 0.0001. The P value answers this question: If there really were no association between disease and risk factor, what is the chance that the two values entered into this analysis would be as far apart as they are, or even further?
Computing the P value with QuickCalcs using McNemar's test
GraphPad's free web QuickCalc computes McNemar's test using a chi-square approximation. Call the two discrepant numbers (25 and 4) R and S. QuickCalc computes chi-square using this equation:
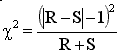
For this example, chi-square=13.79, which has one degree of freedom. The two-tailed P value is 0.0002. If there were really no association between risk factor and disease, there is a 0.02 percent chance that the observed odds ratio would be so far from 1.0 (no association).
The equation above uses the Yates' correction (the "-1" in the equation above). Sometimes this correction is shown as "- 0.5". If you choose the chi-square approach with Prism, no Yates' correction is applied at all. Rather than choosing the chi-square approach (which is an approximation) and worrying about whether to apply the Yates' correction, and which correction to use to, we recommend that you choose the binomial test, which is an exact test.