Meaning of R2
Key points about R2
•The value R2 quantifies goodness of fit.
•It is a fraction between 0.0 and 1.0, and has no units. Higher values indicate that the model fits the data better.
•When R2 equals 0.0, the best-fit curve fits the data no better than a horizontal line going through the mean of all Y values. In this case, knowing X does not help you predict Y.
•When R2=1.0, all points lie exactly on the curve with no scatter. If you know X you can calculate Y exactly.
•You can think of R2 as the fraction of the total variance of Y that is explained by the model (equation). With experimental data (and a sensible model) you will always obtain results between 0.0 and 1.0.
•There is really no general rule of thumb about what values of R2 are high, adequate or low. If you repeat an experiment many times, you will know what values of R2 to expect, and can investigate further when R2 is much lower (or higher) than the expected value.
•By tradition, statisticians use uppercase (R2) for the results of nonlinear and multiple regression and lowercase (r2) for the results of linear regression, but this is a distinction without a difference.
•In linear regression, the R2 compares the fits of the best fit regression line with a horizontal line (forcing the slope to be 0.0). The horizontal line is the simplest case of a regression line, so this makes sense. With many models used in nonlinear regression, the horizontal line is not a simple case and can't be generated at all from the model. So comparing the fits of the chosen model with the fit of a horizontal line doesn't quite make sense. For this reason Minitab does not report R2 with nonlinear regression and SAS callls the value "Pseudo R2".
•Statisticians have actually developed eight different methods for computing R2 for nonlinear regression(1)! As detailed below, Prism uses method 1 from Kvalseth's paper.
Don't overemphasize R2
A common mistake is to use R2 as the main criteria for whether a fit is reasonable. A high R2 tells you that the curve came very close to the points. That doesn't mean the fit is "good" in other ways. The best-fit values of the parameters may have values that make no sense (for example, negative rate constants) or the confidence intervals may be very wide. The fit may be ambiguous. You need to look at all the results to evaluate a fit, not just the R2.
How R2 is calculated -- unweighted fits
R2 is computed from the sum of the squares of the distances of the points from the best-fit curve determined by nonlinear regression. This sum-of-squares value is called SSreg, which is in the units of the Y-axis squared. To turn R2 into a fraction, the results are normalized to the sum of the square of the distances of the points from a horizontal line through the mean of all Y values. This value is called SStot. If the curve fits the data well, SSres will be much smaller than SStot.
The figure below illustrates the calculation of R2. Both panels show the same data and best-fit curve. The left panel also shows a horizontal line at the mean of all Y values, and vertical lines showing how far each point is from the mean of all Y values. The sum of the square of these distances (SStot) equals 62735. The right panel shows the vertical distance of each point from the best-fit curve. The sum of squares of these distances (SSres) equals 4165.

R2 is calculated using this equation:
R2 = 1.0 - (SSres/SStot) =1.0-4165/62735= 0.9336
If you share parameters (perform global nonlinear regression) SSRes in the equation above is the Sum of Squares reported by Prism in Global result column for model with shared parameters being fitted, and SSTot is the Sum of Squares of each Y value (from each data set) around the mean of ALL Y values (from all data sets).
How R2 is calculated -- weighted fits
There does not seem to be an established method for computing the R2 of a weighted nonlinear fit. Prism (since 6.00) calculates as detailed below. But note that earlier versions of Prism computed the R2 of weighted fits differently.
1.Fit the model using relative (1/Y2) or Poisson (1/Y) or general (1/XK)weighting to compute the weighted sum-of-squares (wSSmodel). This is the weighted sum-of-squares of the residuals from your model.
2.Remember the weight each point received.
3.Fit the data to a horizontal line model (Y=Mean + 0*X) using the same weights for each point as used in step 1. This is the weighted sum-of-squares of the residuals from a horizontal line (wSShorizontal).
The weighted R2 is:
1.0 - (wSSmodel/wSShorizontal)
Note that weights are only computed when fitting the model. Prism does not compute weights for the fit of the horizontal line but rather uses exactly the same weights as were used to fit the model. This ensures that the sum of the weights is identical in both fits.
R2 can be negative!
Appearances can be deceptive. R2 is not really the square of anything. If SSres is larger than SStot, R2 will be negative (see equation above). While it is surprising to see something called "squared" have a negative value, it is not impossible (since R2 is not actually the square of R).
How can this happen? SSres is the sum of the squares of the vertical distances of the points from the best-fit curve (or line). SStot is the sum of the squares of the vertical distances of the points from a horizontal line drawn at the mean Y value. SSres will exceed SStot when the best-fit line or curve fits the data even worse than does a horizontal line.
R2 will be negative when the best-fit line or curve does an awful job of fitting the data. This can only happen when you fit a poorly chosen model (perhaps by mistake), or you apply constraints to the model that don't make any sense (perhaps you entered a positive number when you intended to enter a negative number). For example, if you constrain the Hill slope of a dose-response curve to be greater than 1.0, but the curve actually goes downhill (so the Hill slope is negative), you might end up with a negative R2 value and nonsense values for the parameters.
Below is a simple example. The blue line is the fit of a straight line constrained to intercept the Y axis at Y=150 when X=0. SSres is the sum of the squares of the distances of the red points from this blue line. SStot is the sum of the squares of the distances of the red points from the green horizontal line. Since Sres is much larger than SStot, the R2 (for the fit of the blue line) is negative.
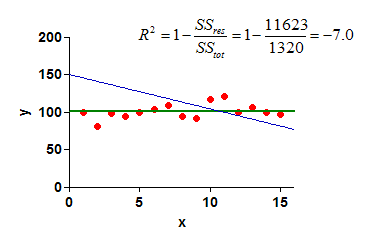
If R2 is negative, check that you picked an appropriate model, and set any constraints correctly.
Adjusted R2
The R2 quantifies how well a model fits the data. When you compare models, the one with more parameters can bend and twist more to come nearer the points, and so almost always has a higher R2. This is a bit misleading.
The adjusted R2 accounts for the number of parameters fit by the regression, and so can be compared between models with different numbers of parameters. The equations for the regular and adjusted R2 are compared here (SSresiduals is the sum-of-squares of the discrepancy between the Y value of the curve and the data; SStotal is the sum-of-squares of the differences between the overall Y mean and each Y value; n is the number of data points, and K is the number of parameters fit):
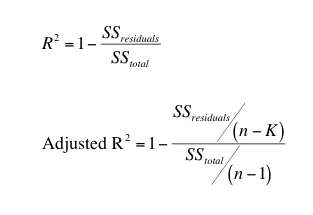
The adjusted R2 is smaller than the ordinary R2 whenever the number of parameters (K) is greater than 1.
1. Kvalseth, T.O. (1985) Cautionary Note about R2. American Statistician, 39, 279-285.